

- Ethereum’s volatility surpasses Bitcoin’s with a 30% higher spread, showing more price swings.
- ETH’s recent price changes are more drastic, with fluctuations over 6%, versus Bitcoin’s 3%.
- Current ETH RSI at 42.84 suggests it’s nearing oversold conditions, with potential downward momentum.
Data from Matrixport reveals that Ethereum’s (ETH) volatility has recently outpaced Bitcoin’s (BTC), capturing the attention of investors and analysts. The 30-day realized volatility spread between Ethereum ( ETH ) and Bitcoin (BTC) has typically ranged from 1.0 to 1.5, indicating that Ethereum has often been up to 50% more volatile than Bitcoin. This heightened volatility suggests a more unpredictable market for Ethereum, which might influence investment decisions.
The volatility spread is approximately 1.3, meaning Ethereum is currently about 30% more volatile than Bitcoin. This difference in volatility has been significant, especially since the start of the recent bull market. Ethereum’s increased volatility may have lessened its attractiveness as a stable investment compared to Bitcoin.
A closer look at price movements reveals further insights. Ethereum’s price swings are more pronounced, with sharper peaks and troughs compared to Bitcoin. For instance, Ethereum has demonstrated more aggressive price movements, often experiencing percentage changes exceeding 6%. This is notably higher than Bitcoin’s more stable price variations, which generally remain below 3%. Such dramatic swings in Ethereum’s price indicate a higher risk and potential for substantial returns or losses.
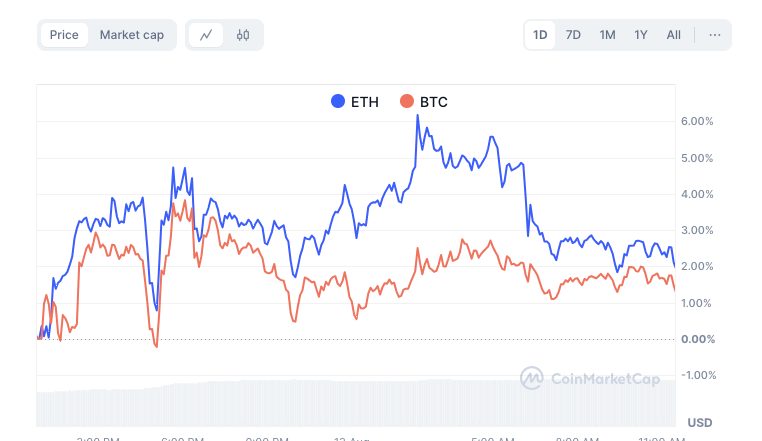
ETH vs BTC 1-day price chart, Source: Coinmarketcap
As at press time, Ethereum is priced at $2,637.72 , with a 24-hour trading volume of $21.31 billion, reflecting a 1.95% increase over the past day. In contrast, Bitcoin is trading at $58,991.57 , with a 24-hour volume of $35.07 billion, showing a modest 0.23% rise. These figures underscore Ethereum’s recent performance and its increased volatility compared to Bitcoin.
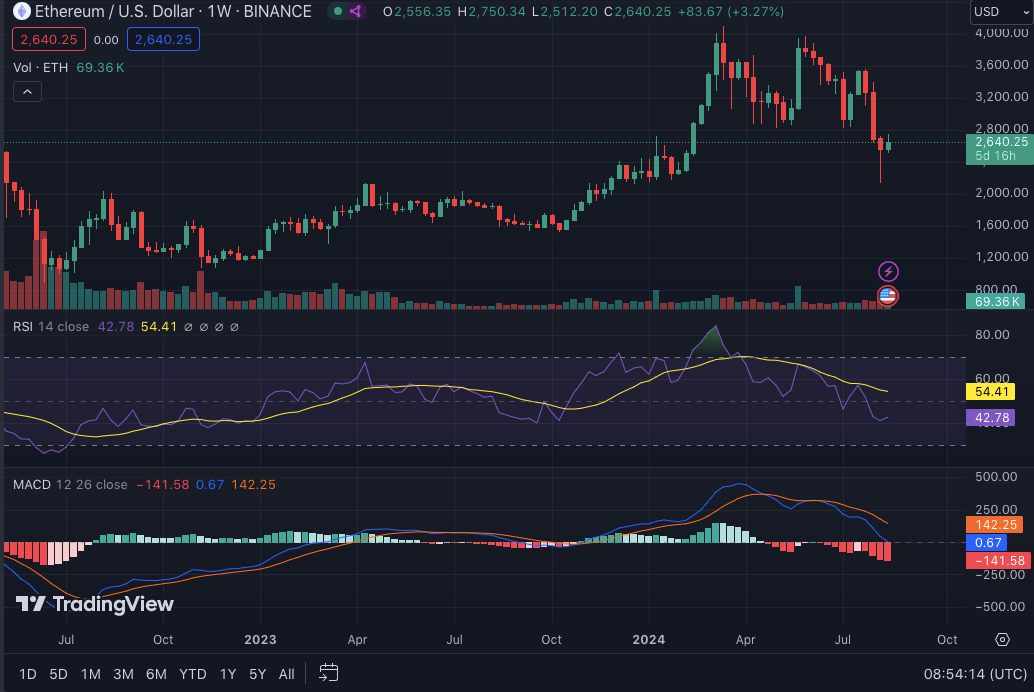
ETH/USD 1-week price chart, Source: Trading view
Technical indicators also provide valuable clues about the short-term outlook for both cryptocurrencies. Ethereum’s 1-week Relative Strength Index (RSI) is at 42.84, suggesting it may be approaching oversold conditions. Additionally, the 1-week Moving Average Convergence Divergence (MACD) is below the signal line, indicating possible downward momentum.
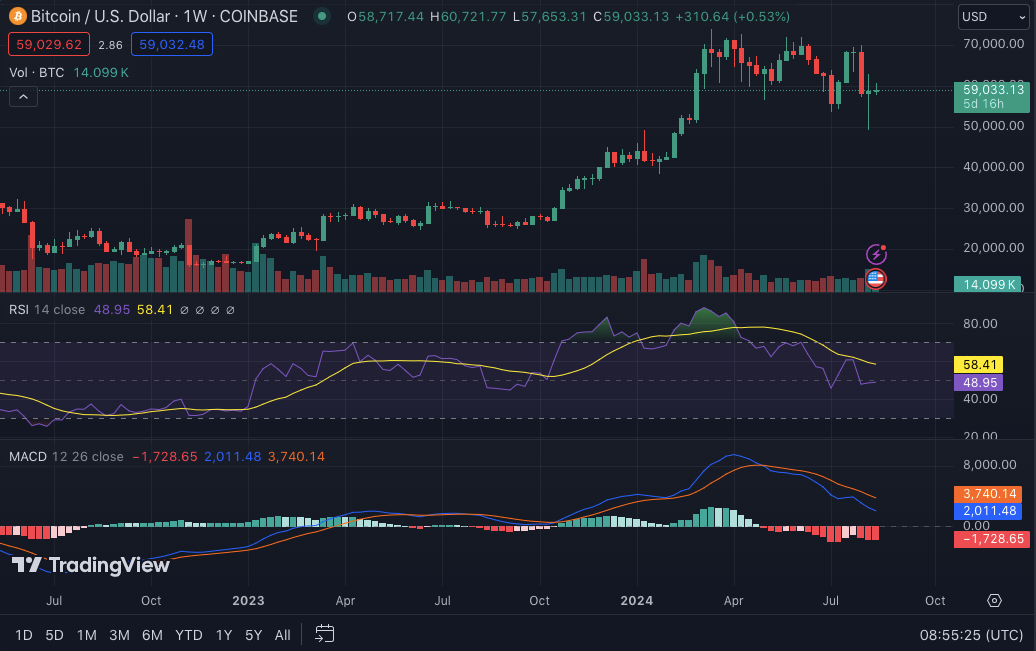
BTC/USD 1-week price chart, Source: Trading view
Conversely, Bitcoin’s 1-week RSI is at 49.01, placing it in a neutral zone. However, Bitcoin’s MACD is also trading below the signal line, hinting at a potential bearish trend in the near term.
Disclaimer: The information presented in this article is for informational and educational purposes only. The article does not constitute financial advice or advice of any kind. Coin Edition is not responsible for any losses incurred as a result of the utilization of content, products, or services mentioned. Readers are advised to exercise caution before taking any action related to the company.