
Ethereum transaction fees surge as blockchain activity ramps up: Coinbase

Ethereum transaction fees have surged in the past week due to a significant uptick in on-chain activity across the blockchain, according to Coinbase.Meanwhile, ether has broken above its relative strength index (RSI) downtrend line that began at March’s multi-year high of over $4,000, signaling a potential bullish shift in momentum, Kraken analysts reported.
Ethereum ETH +1.30% transaction fees have ticked upwards over the past week amidst a widespread resurgence in the blockchain's onchain activity, according to Coinbase.
"The average gas price in the past 10 days, September 16 to September 26, has risen 498% above the preceding 30-day average, and the median transaction on Ethereum now costs $1.69 compared to $0.09 at the start of the month," Coinbase analysts David Duong and David Han said in Friday's Coinbase Weekly report.
The analysts noted that the uptick in activity has no single driver but highlighted several contributing factors. Ethereum decentralized exchange (DEX) volumes have increased slightly, up 9% week-on-week. Additionally, total ether transfer volumes have grown by 17% week-on-week, corresponding with higher transaction fees, the analysts added.
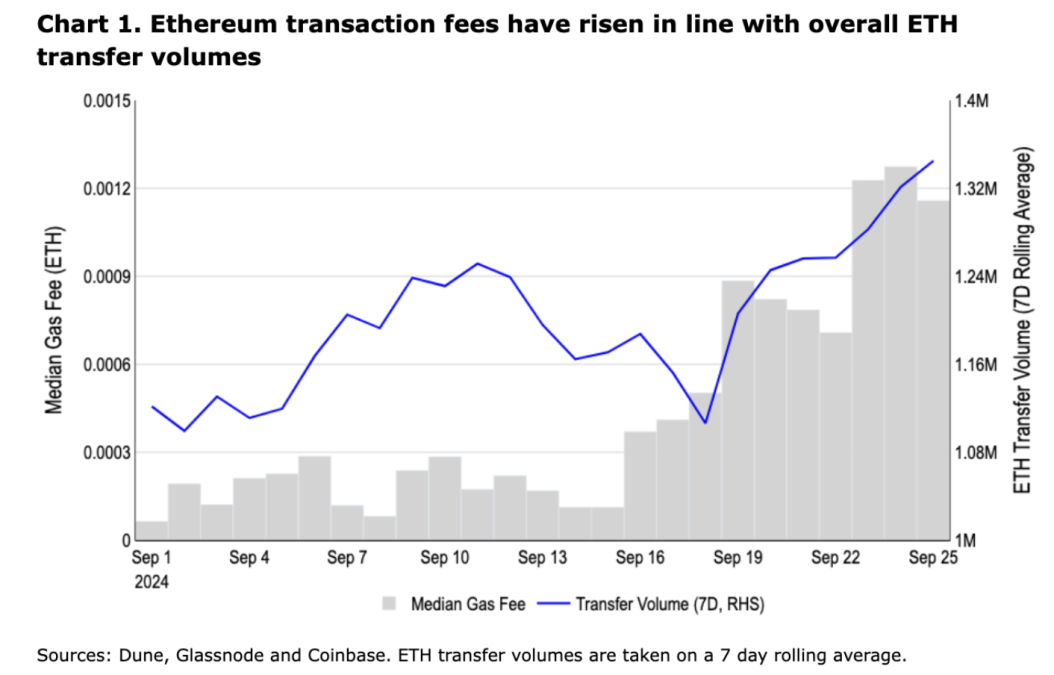
Ethereum transaction fees have surged in the past week due to an uptick in on-chain activity across the blockchain: Coinbase
Ethereum breaks above key chart indicator
Ethereum has broken above its relative strength index (RSI) downtrend line, which dates back to its multi-year high of over $4,000 in March, signaling a potential bullish shift in the digital asset’s near-term momentum, according to analysts at Kraken.
"Ethereum has recently broken above its RSI downtrend line originating from the March 11 high, indicating a potential bullish shift in near-term momentum," the Kraken OTC analysis team said in their latest report. This shift could lead to further price gains, with the key resistance level to watch now being the $2,813 pivot, the analysts said.
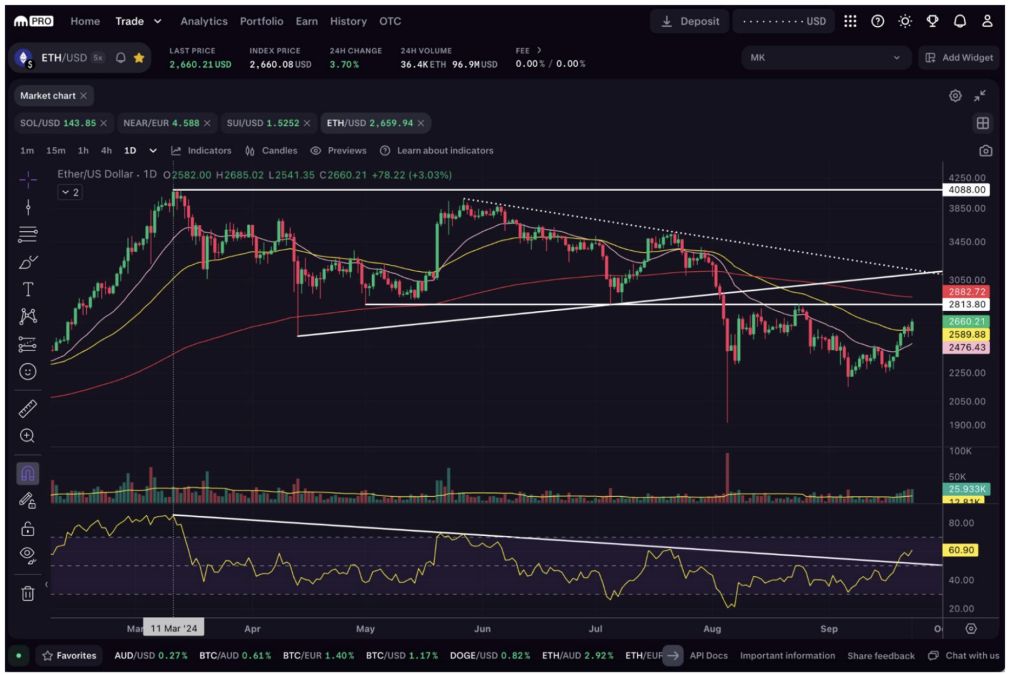
Ethereum has broken above a key chart indicator, signaling a potential bullish shift in momentum, according to analysts at Kraken. Image: Kraken.
However, the analysts cautioned that despite this positive change in momentum, Ethereum remains below its 200-day exponential moving average (EMA), which currently stands at $2,882. "This moving average continues to act as a significant resistance level, and ether will need to reclaim it to confirm a bullish reversal of its long-term trend," they said.
The report emphasized that market participants should closely monitor Ethereum’s interaction with the 200-day EMA, as it will likely be a decisive factor in determining the next major price move.
Positive signs in the ether derivatives market
There are also signs of renewed optimism in the ether derivatives market. The futures funding rate 30-day moving average has shown a positive shift, indicating growing bullish sentiment among futures traders, according to CryptoQuant Head of Research Julio Moreno.
"In general, positive and increasing funding rates show the willingness of traders to open long positions in the perpetual futures market. It is historically associated with the expectation of higher prices," Moreno told The Block.
He emphasized, however, that this slight increase alone does not guarantee a sustainable price rally for ether. "But, the increase in the funding rate 30-day moving average is a positive sign," he added.
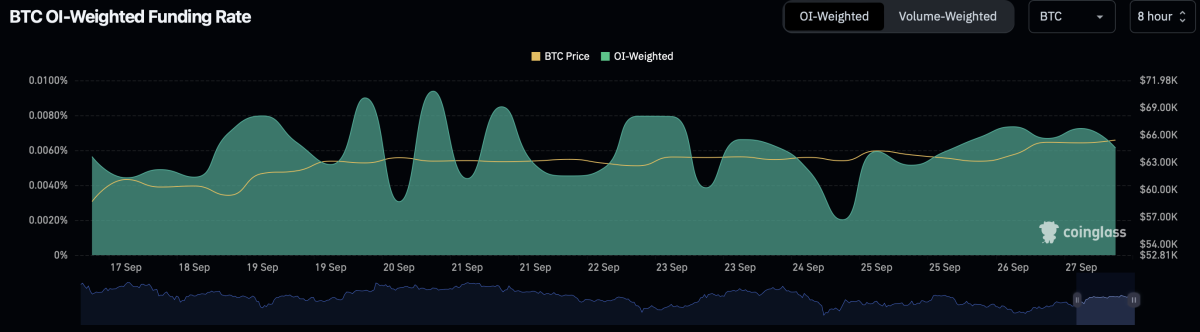
Ethereum's open interest-weighted funding rate has remained positive since the U.S. Federal Reserve rate cut on September 18. Image: Coinglass
Data from Coinglass also highlights that Ethereum’s open interest-weighted funding rate has been trending positively since the U.S. Federal Reserve's interest rate cut on September 18, currently standing at 0.0061%.
The price of ether increased by over 1.6% in the past 24 hours to trade at $2,687 at 11:28 a.m. ET. Bitcoin dominance is at 53.8%, and ether dominance is at 13.3%, according to CoinGecko data.
Disclaimer: The content of this article solely reflects the author's opinion and does not represent the platform in any capacity. This article is not intended to serve as a reference for making investment decisions.
You may also like
100% rebate for KYB users: Earn fee rebates on EUR bank deposits!
[Initial listing] Bitget to list Talus (US) in the Innovation and AI zone
Bitget Trading Club Championship (Phase 21)—Up to 1250 BGB per user, plus a ZETA pool and Mystery Boxes
Bitget Spot Margin Announcement on Suspension of MDT/USDT, RAD/USDT, FIS/USDT, CHESS/USDT, RDNT/USDT Margin Trading Services