Bitcoin Price Back at Support: Can It Avoid a Breakdown?

Bitcoin price started a fresh decline below the $65,000 level. BTC is now testing the $62,850 support zone and might start another increase.
- Bitcoin is correcting below the $65,500 zone.
- The price is trading below $65,000 and the 100 hourly Simple moving average.
- There is a connecting bearish trend line with resistance at $63,500 on the hourly chart of the BTC/USD pair (data feed from Kraken).
- The pair could start another increase if it stays above the $62,500 support zone.
Bitcoin Price Revisits Support
Bitcoin price started a fresh decline from the $66,000 resistance. BTC broke the $65,000 and $64,500 support levels to move into a short-term bearish zone.
The price even dipped below $63,500. A low was formed at $62,883 and the price is now consolidating losses. The price is now trading below the 23.6% Fib retracement level of the downward move from the $66,055 swing high to the $62,833 low.
Bitcoin is now trading below $64,500 and the 100 hourly Simple moving average . If there is a fresh increase, the price could face resistance near the $63,500 level. There is also a connecting bearish trend line with resistance at $63,500 on the hourly chart of the BTC/USD pair.
The first key resistance is near the $64,500 level. It is close to the 50% Fib retracement level of the downward move from the $66,055 swing high to the $62,833 low.
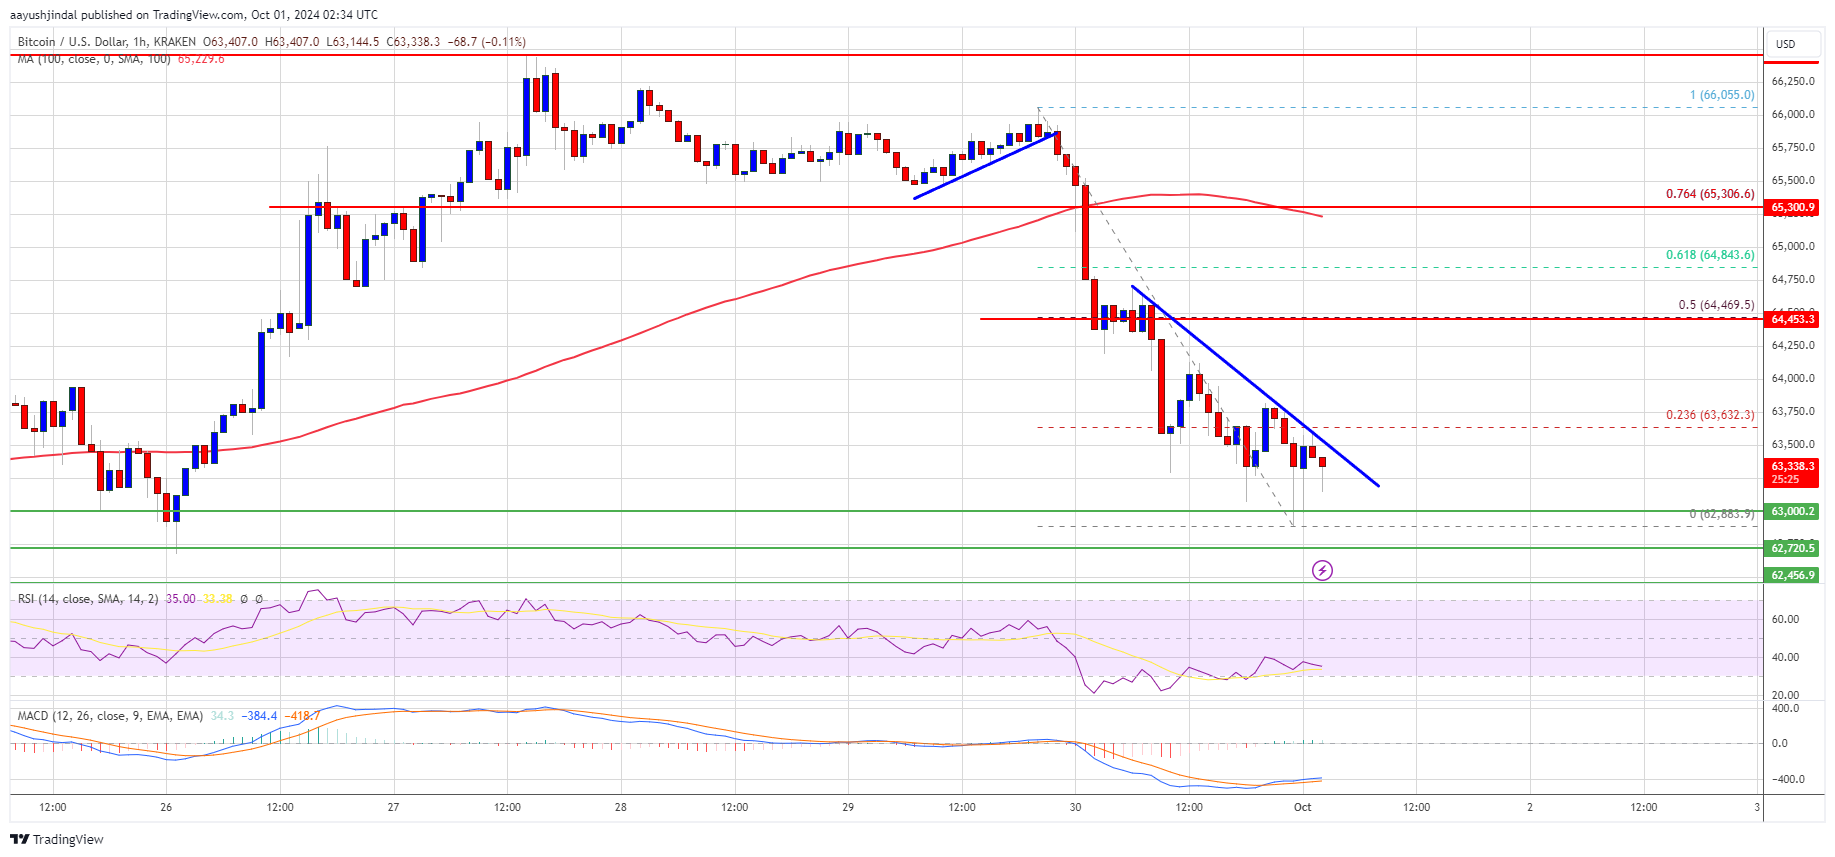
A clear move above the $64,500 resistance might send the price higher. The next key resistance could be $65,500. A close above the $65,500 resistance might spark more upsides. In the stated case, the price could rise and test the $66,200 resistance level. Any more gains might send the price toward the $68,000 resistance level.
More Losses In BTC?
If Bitcoin fails to rise above the $63,500 resistance zone, it could continue to move down. Immediate support on the downside is near the $63,000 level.
The first major support is near the $62,850 level. The next support is now near the $62,500 zone. Any more losses might send the price toward the $61,200 support in the near term.
Technical indicators:
Hourly MACD – The MACD is now gaining pace in the bearish zone.
Hourly RSI (Relative Strength Index) – The RSI for BTC/USD is now below the 50 level.
Major Support Levels – $62,850, followed by $62,500.
Major Resistance Levels – $63,500, and $64,500.
Disclaimer: The content of this article solely reflects the author's opinion and does not represent the platform in any capacity. This article is not intended to serve as a reference for making investment decisions.
You may also like
Price predictions 12/10: BTC, ETH, XRP, BNB, SOL, DOGE, ADA, BCH, LINK, HYPE

Ether vs. Bitcoin: ETH price poised for 80% rally in 2026

Prediction markets bet Bitcoin won’t reach $100K before year’s end

Bitcoin rallies fail at $94K despite Fed policy shift: Here’s why