
Analyst Hints at Ethereum Price Repeating 2,738% Rally Pattern From 2016

Ethereum’s price consolidation could soon end, with a breakout possible above $2,700. Historical patterns support ETH’s potential rally.
Ethereum’s price has been stuck in a consolidation phase, trading between $2,700 and $2,340, without a clear breakout in sight.
Despite recent dips below its uptrend line, a historical pattern suggests the possibility of a future rally. If Ethereum can maintain key support levels, a breakout may be on the horizon.
Ethereum Repeats History
Analyst CryptoBullet recently highlighted that the ETH/BTC chart may be forming a bottom, resembling a pattern seen in late 2016. At that time, Ethereum rallied 2,738% over the following months. While such a spike is unlikely in today’s market, the formation is encouraging for investors.
However, expecting a 2,738% surge for ETH in current conditions would imply a climb above $66,000, which is unrealistic. Still, even a fraction of this historical rally could produce significant gains. If Ethereum’s ETH/BTC pair successfully establishes a bottom, it could pave the way for a sustainable rise over the coming months, supported by strong market sentiment.
Read more: How to Invest in Ethereum ETFs?
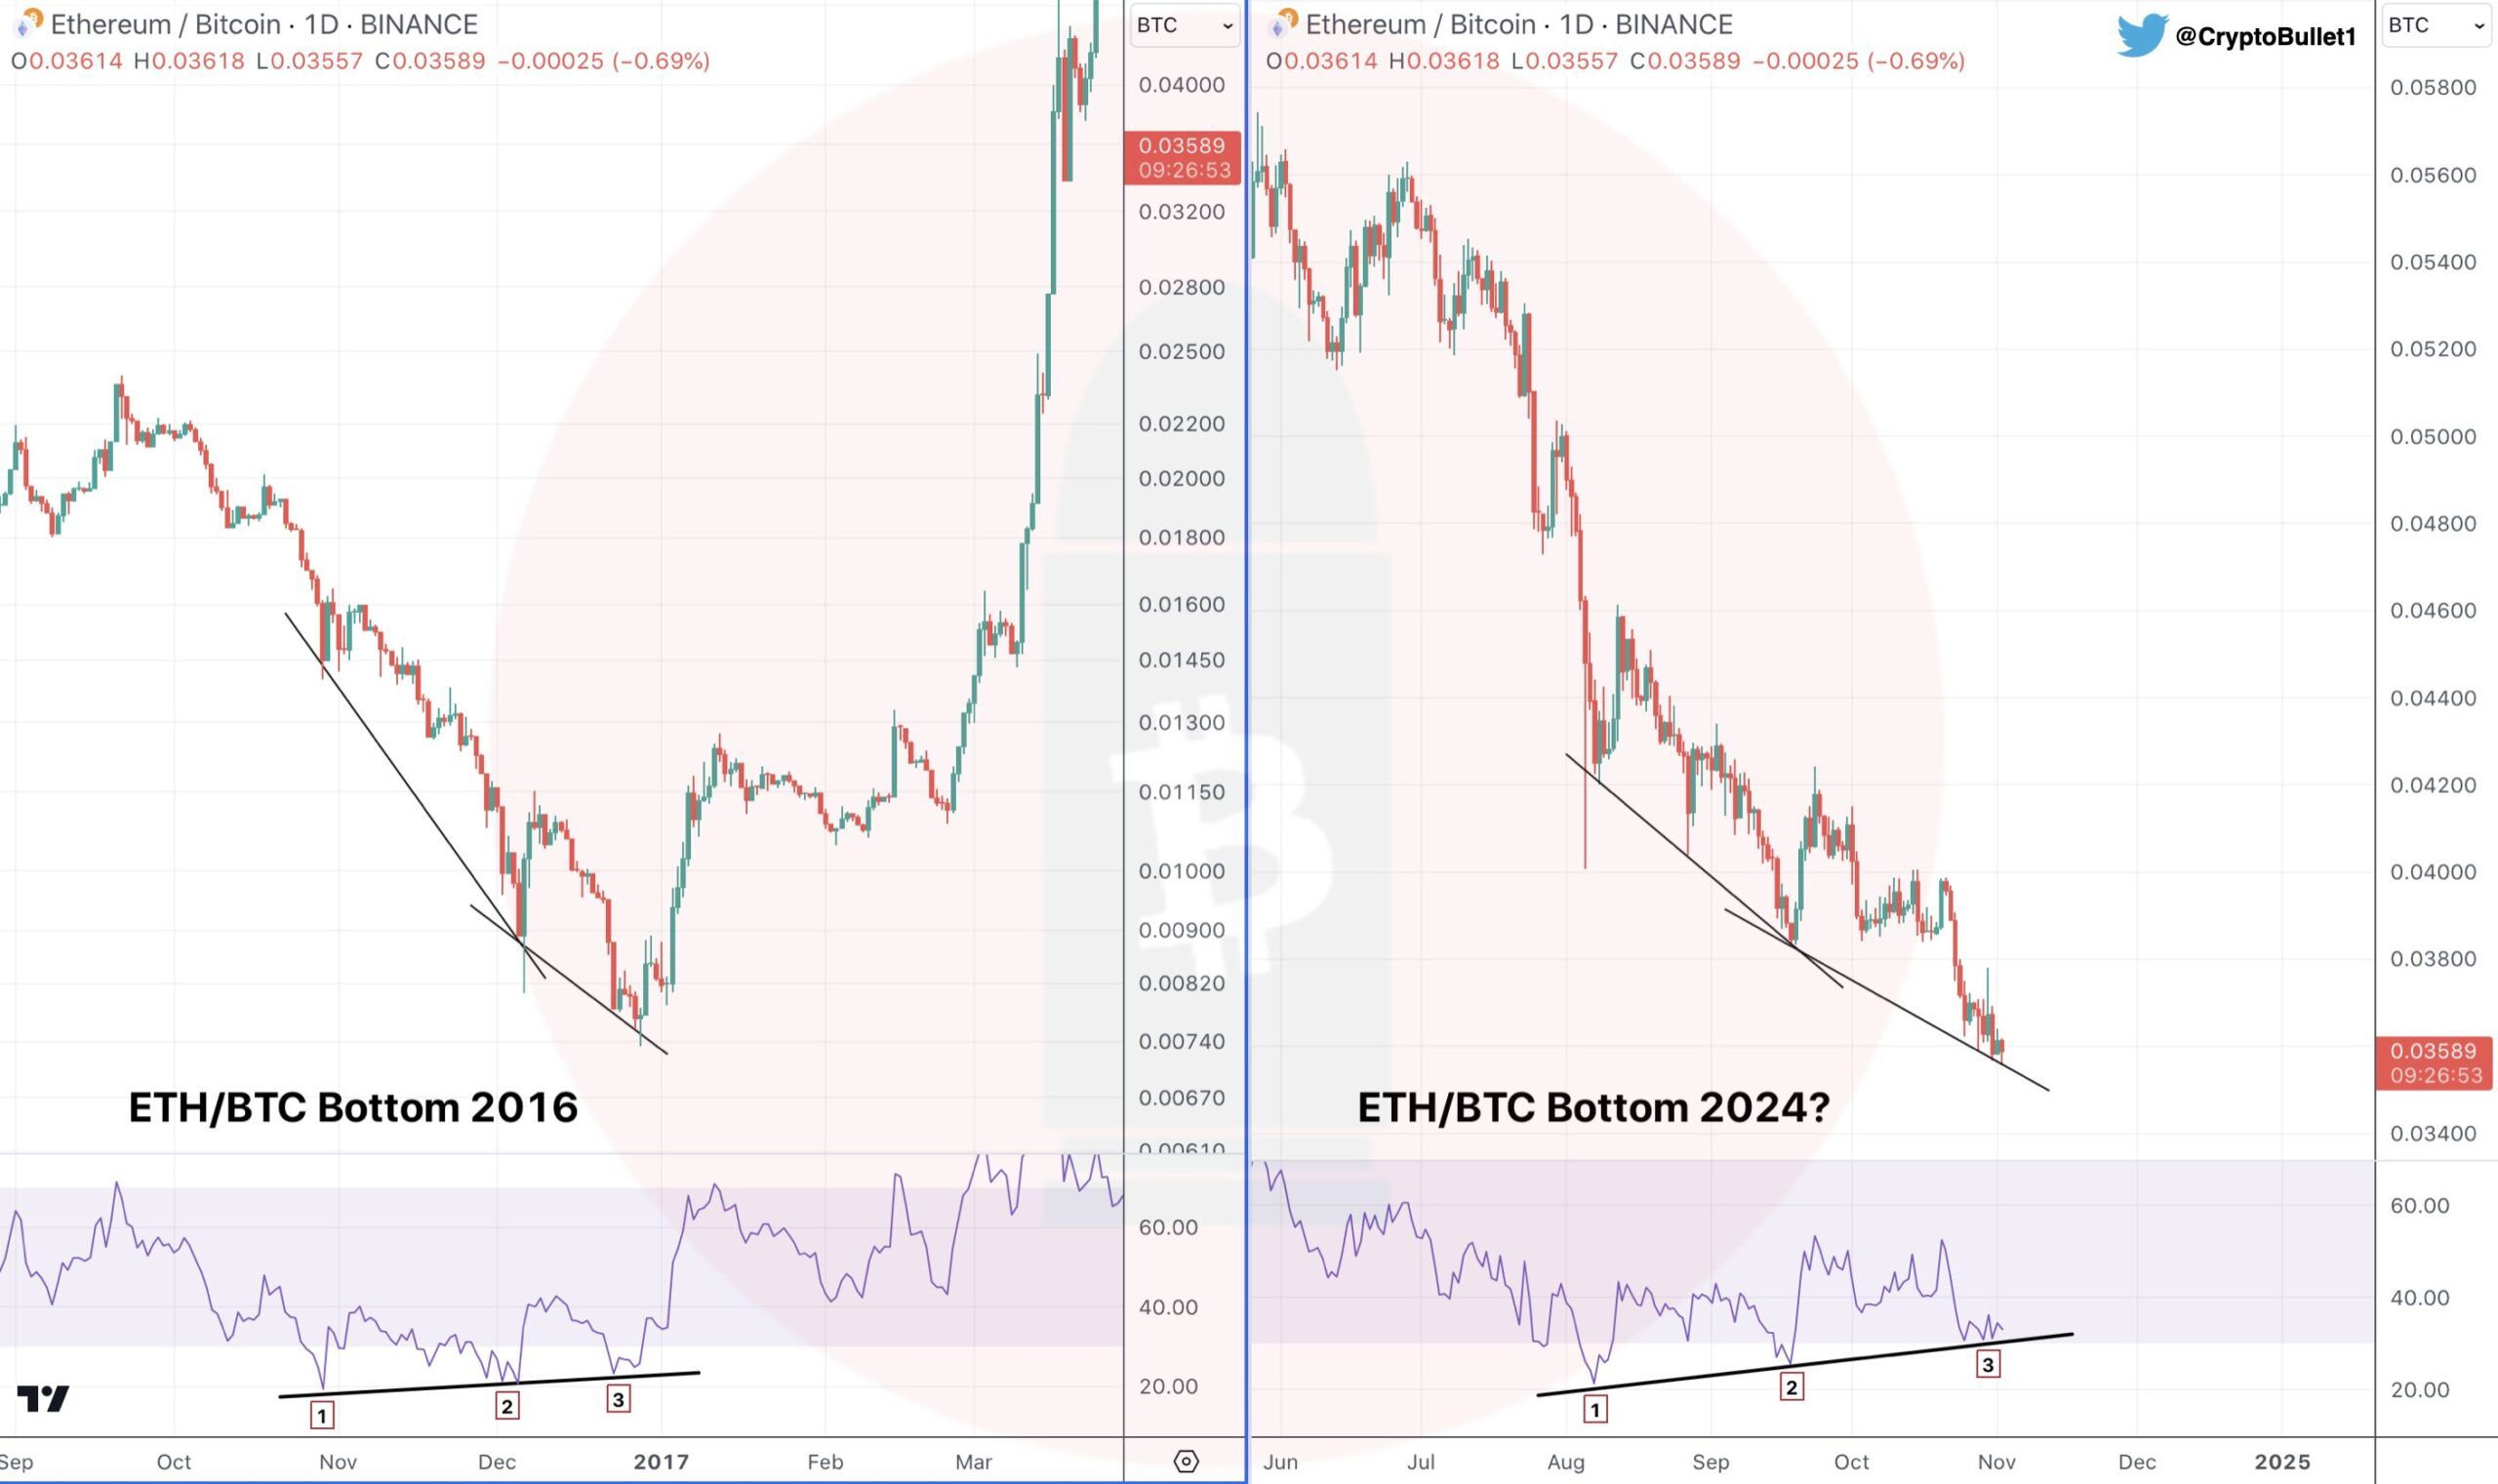 ETH/BTC Bottom Pattern. Source:
CryptoBullet
ETH/BTC Bottom Pattern. Source:
CryptoBullet
Ethereum’s macro momentum also points to potential upside. The daily on-chain transaction volume in profit has been consistently outpacing transactions in loss, signaling an underlying strength in Ethereum’s market conditions. This suggests that a large portion of ETH holders are in profit, which could support a breakout from the ongoing consolidation.
Higher volumes in profitable transactions typically hint at bullish sentiment. When more transactions generate profit, it can reinforce Ethereum’s price resilience, especially as traders anticipate further gains. This momentum positions Ethereum well for an eventual escape from its current range, as demand could increase if ETH approaches its upper limits.
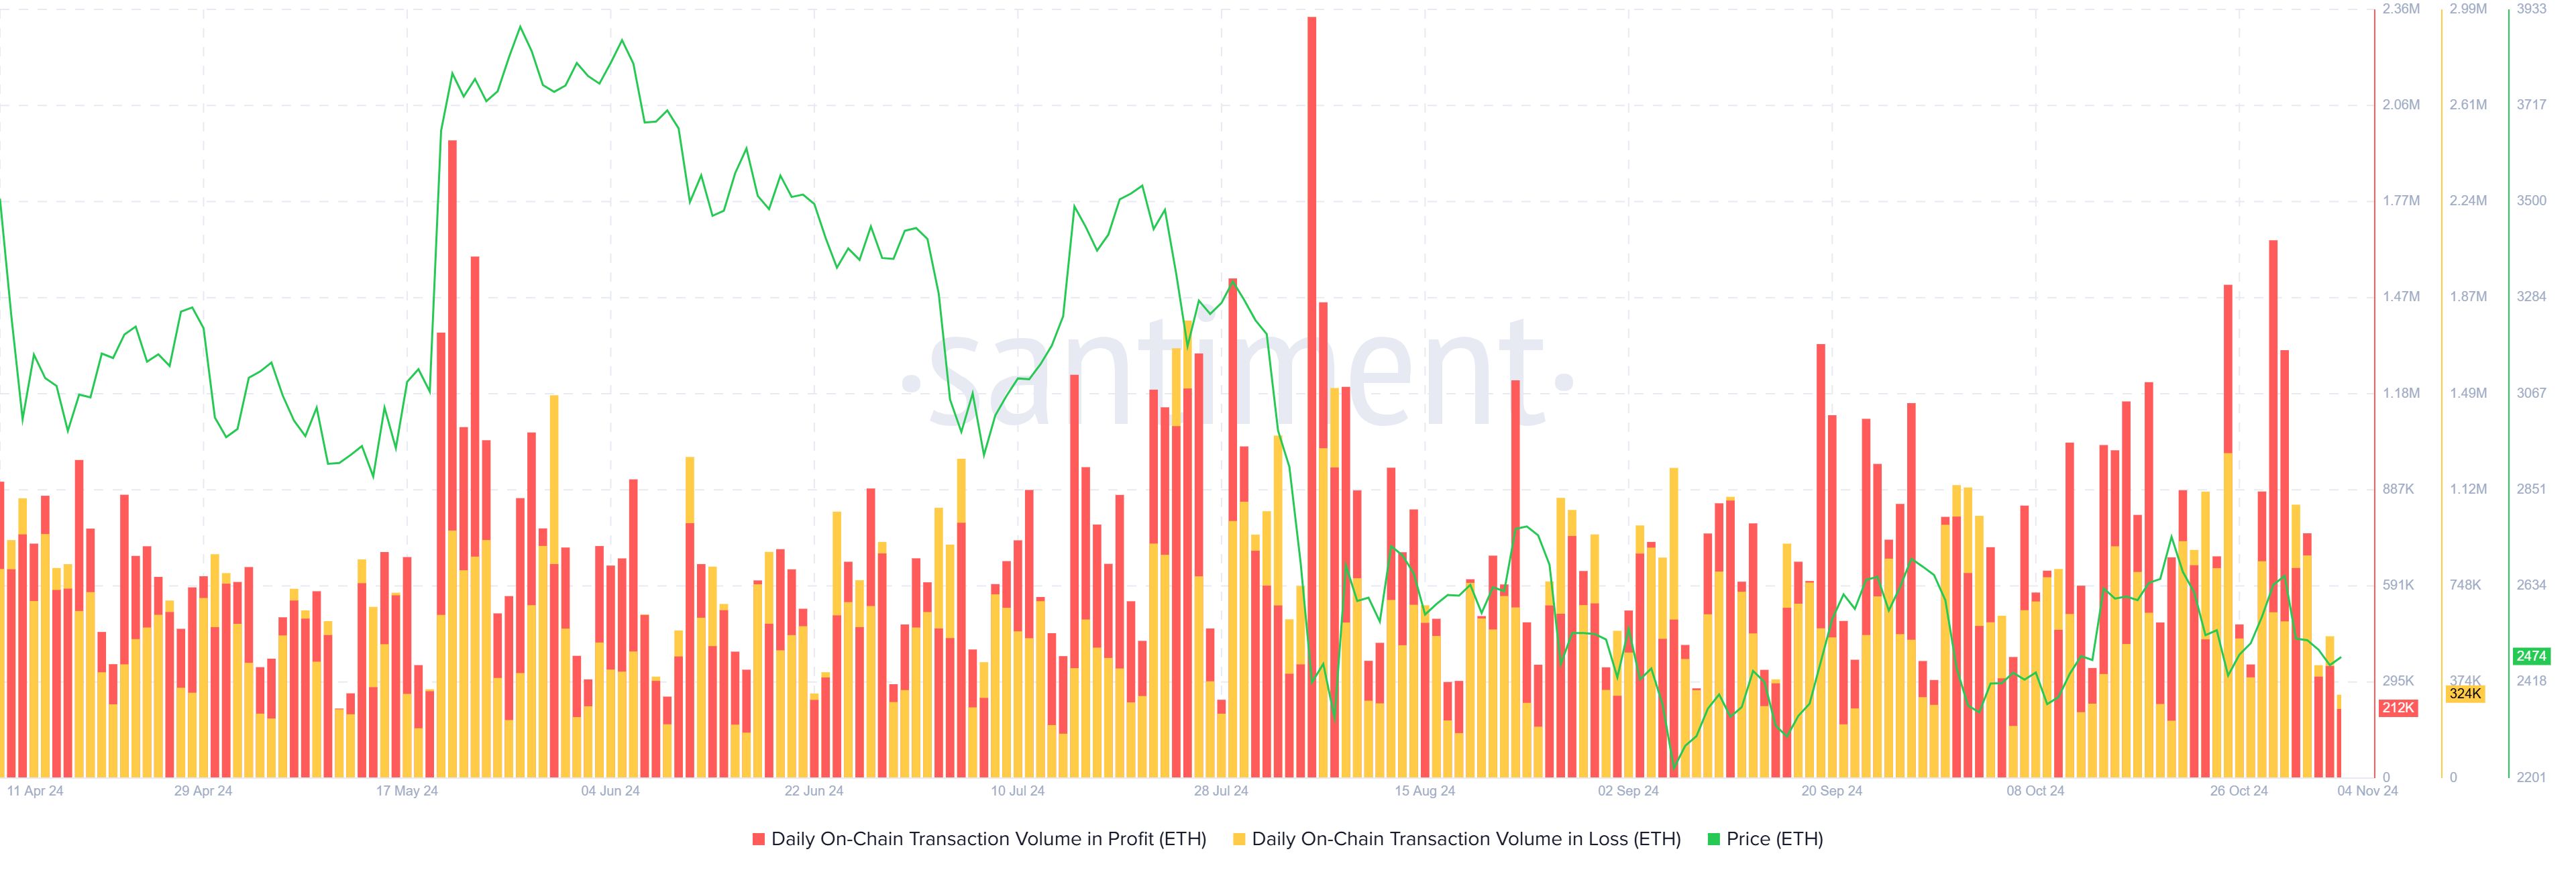 Ethereum Transaction Volume in Profit/Loss. Source:
Santiment
Ethereum Transaction Volume in Profit/Loss. Source:
Santiment
ETH Price Prediction: Short-Term Goals
For Ethereum’s consolidation to break, flipping $2,700 into support will be critical. Achieving this level would affirm a bounce from $2,546, helping ETH maintain its uptrend line established in September. Holding above these support levels would signal a continuation of Ethereum’s strength.
If ETH successfully turns $2,700 into a support level, the next target would be $3,000. This is a realistic outlook compared to the more speculative gains seen in the past. Achieving $3,000 could encourage new buying, potentially extending Ethereum’s rally.
Read more: Ethereum (ETH) Price Prediction 2024/2025/2030
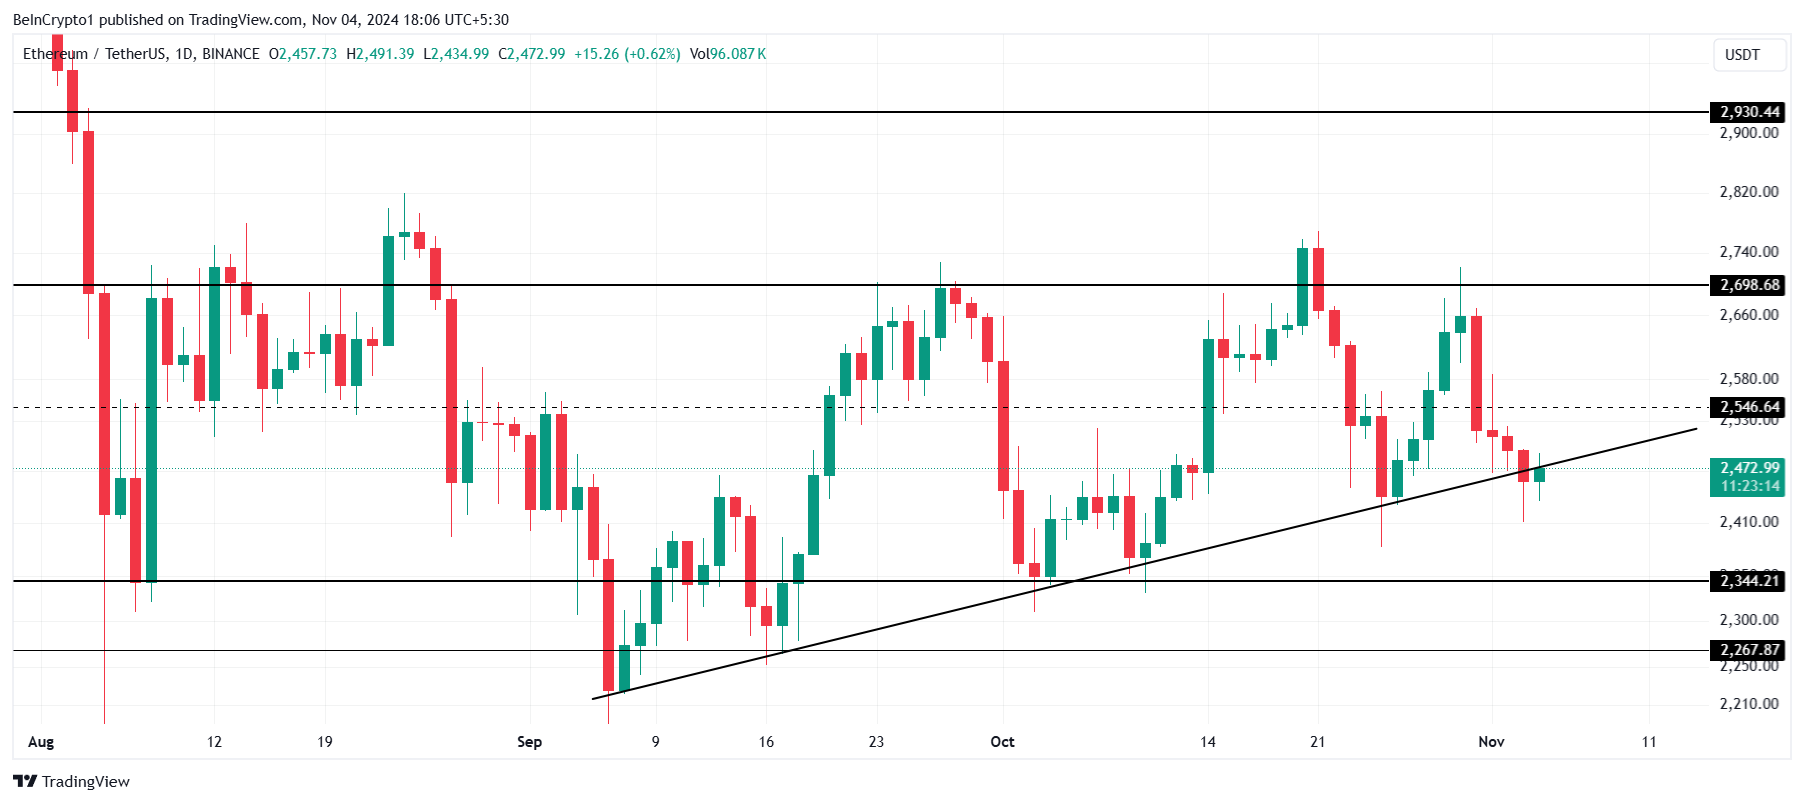 Ethereum Price Analysis. Source:
TradingView
Ethereum Price Analysis. Source:
TradingView
However, this bullish scenario could be negated if Ethereum loses support at the uptrend line and drops to $2,344. Such a decline would increase bearish pressure, challenging Ethereum’s ability to regain upward momentum in the near term.
Disclaimer: The content of this article solely reflects the author's opinion and does not represent the platform in any capacity. This article is not intended to serve as a reference for making investment decisions.
You may also like
New spot margin trading pair — HOLO/USDT!
FUN drops by 32.34% within 24 hours as it faces a steep short-term downturn
- FUN plunged 32.34% in 24 hours to $0.008938, marking a 541.8% monthly loss amid prolonged bearish trends. - Technical breakdowns, elevated selling pressure, and forced liquidations highlight deteriorating market sentiment and risk-off behavior. - Analysts identify key support below $0.0080 as critical, with bearish momentum confirmed by RSI (<30) and MACD indicators. - A trend-following backtest strategy proposes short positions based on technical signals to capitalize on extended downward trajectories.

OPEN has dropped by 189.51% within 24 hours during a significant market pullback
- OPEN's price plummeted 189.51% in 24 hours to $0.8907, marking its largest intraday decline in history. - The token fell 3793.63% over 7 days, matching identical monthly and yearly declines, signaling severe bearish momentum. - Technical analysts cite broken support levels and lack of bullish catalysts as key drivers of the sustained sell-off. - Absence of stabilizing volume or reversal patterns leaves the market vulnerable to further downward pressure.

New spot margin trading pair — LINEA/USDT!