

-
The cryptocurrency Hedera (HBAR) has demonstrated significant upward momentum, surging 21.43% in just one week and an astonishing 172.58% over the course of the past month.
-
This robust performance is underpinned by favorable Exponential Moving Average (EMA) trends, complemented by a strong Average Directional Index (ADX) reading of 52, indicating strong price movement.
-
Notably, resistance levels are observed at $0.157 and $0.1711, while support levels exist at $0.117 and $0.053, suggesting possible volatility ahead as market dynamics shift.
This article examines the recent surge of Hedera (HBAR), analyzing key technical indicators and potential price movements in the evolving crypto landscape.
HBAR’s Upward Trend and Potential Challenges
The recent spike in Hedera’s (HBAR) price is largely attributed to favorable market conditions, reflected in the short-term EMA lines surpassing their long-term counterparts. This scenario typically suggests a consistent bullish trend; however, it’s crucial to observe accompanying market indicators.
The DMI chart reveals an ADX reading of 52, which indicates a prevailing strong trend. Values exceeding 40 present an exceptional trend strength, flagging HBAR’s current market position as notably positive. This has been sustained since mid-November, signifying a robust interest among investors.
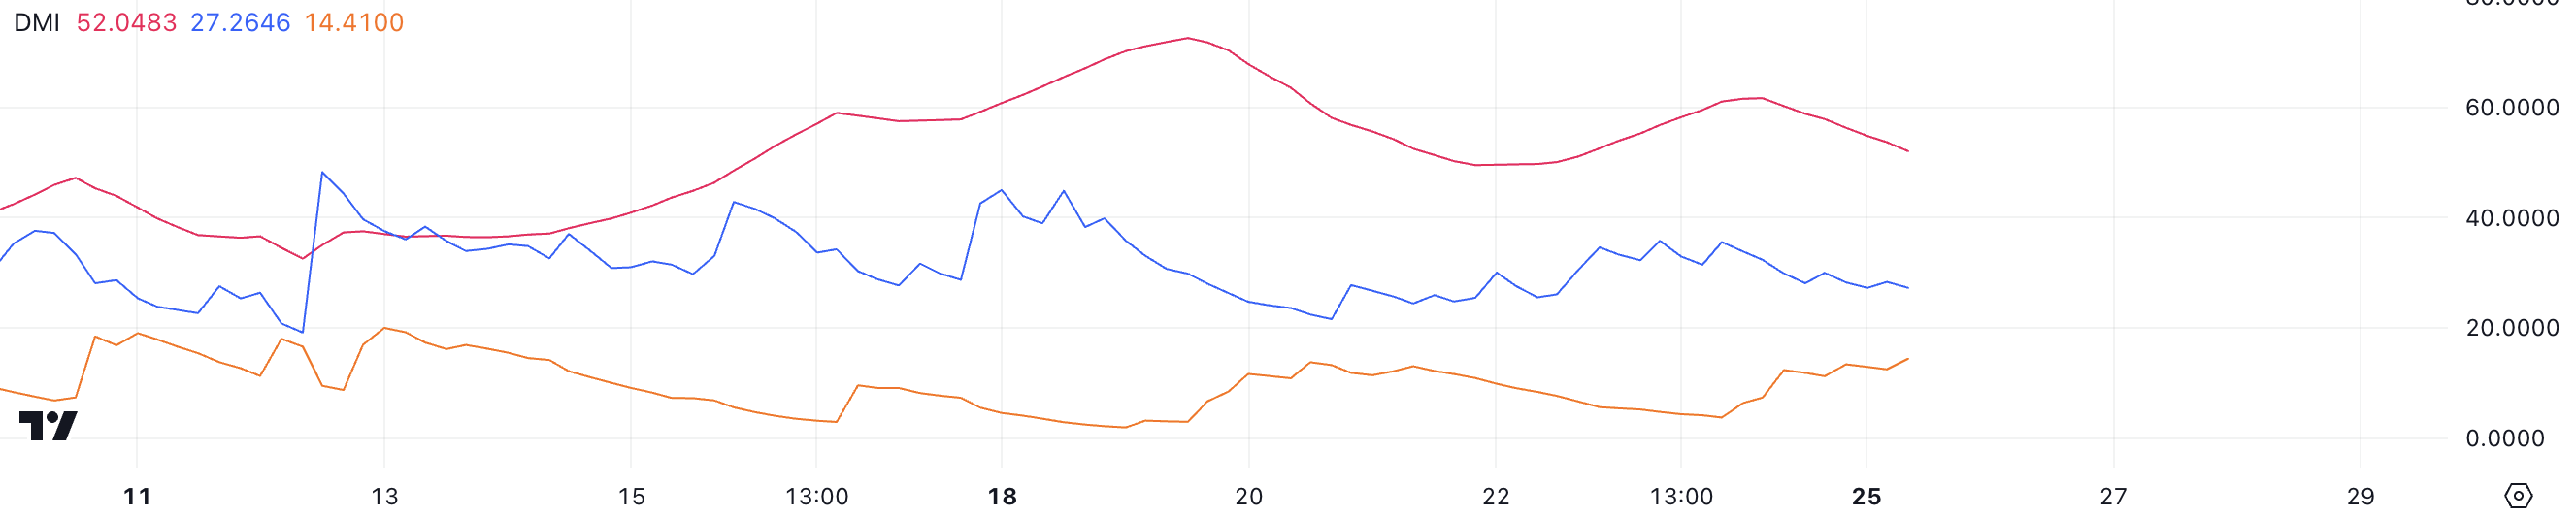
Currently, however, with HBAR’s D+ at 27.2 and D- at 14.4, the data indicates an upward trend is ostensibly intact. Nevertheless, a notable divergence is visible; the D+ is decreasing while D- is on the rise, which may hint at rising selling pressure in the market. This situation poses a potential risk to the current bullish sentiment.
Ichimoku Cloud Analysis: A Cautionary Signal
The Ichimoku Cloud analysis of HBAR reveals that the price is positioned near the Kijun-Sen and Tenkan-Sen lines, suggesting a consolidation phase is underway. Importantly, the flat appearance of the Kijun-Sen indicates a current lack of decisive momentum, casting uncertainty over HBAR’s immediate price trajectory.
While the price remains above the cloud, which traditionally acts as a support zone, the struggle to maintain levels above the Kijun-Sen reveals difficulties in sustained upward movement. A breakdown through the cloud could signal increased bearish sentiment, prompting potential re-evaluations of HBAR’s price forecast.
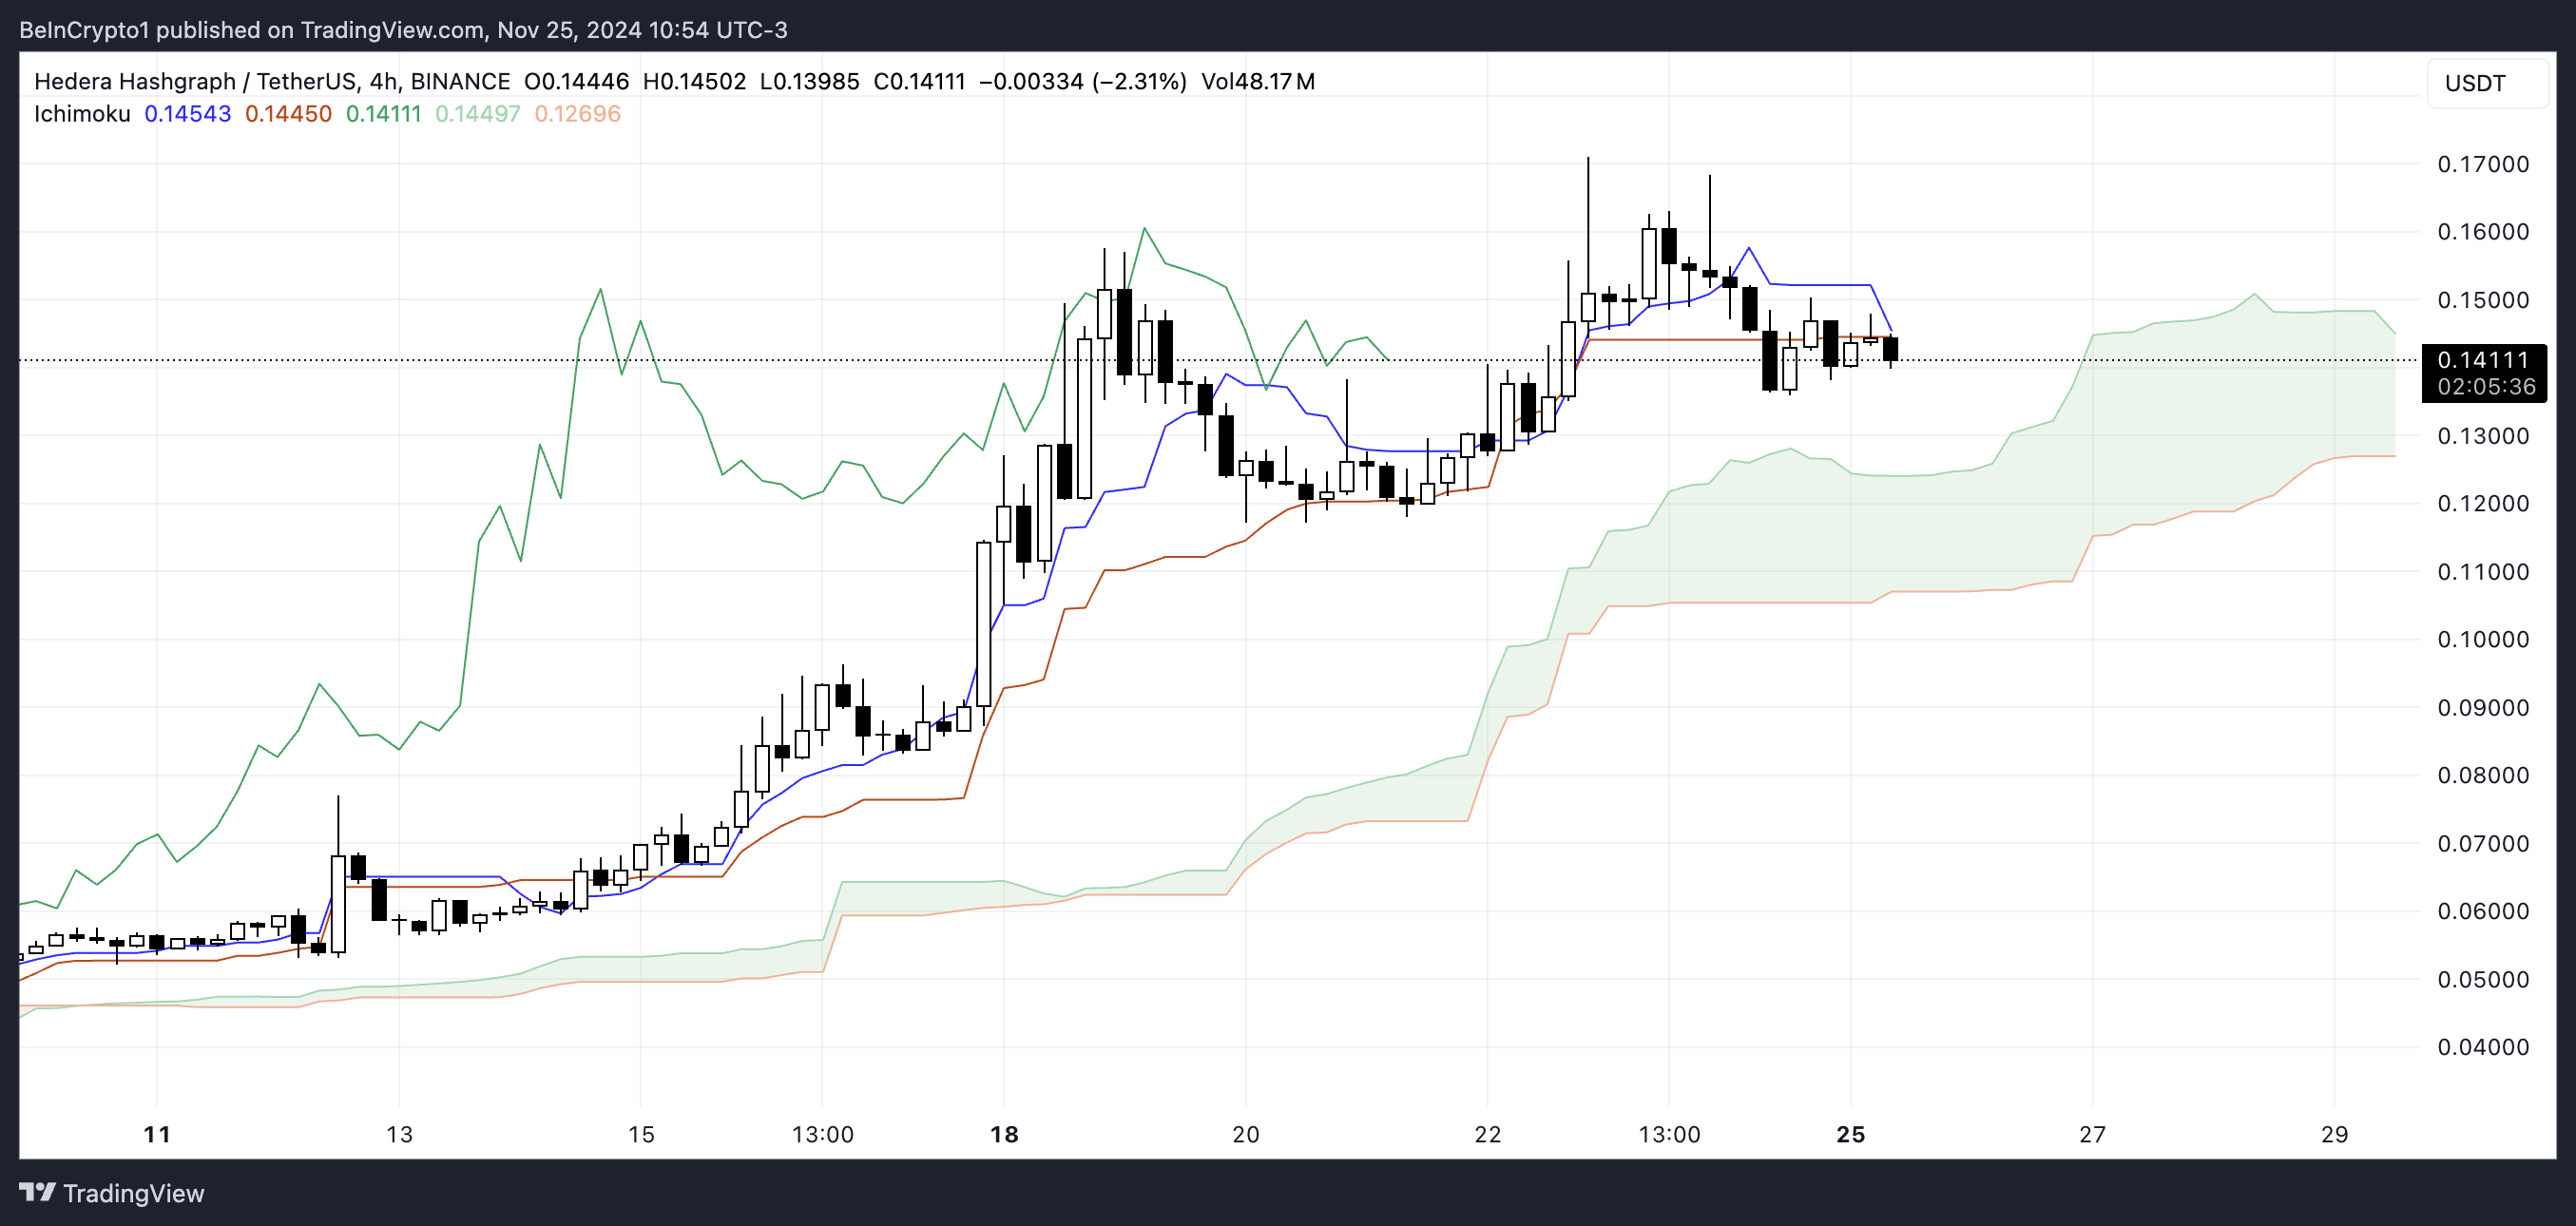
Should HBAR maintain its support above the cloud, a bullish reversal could materialize, directing focus towards upcoming resistance levels. Conversely, if the price dips below this support threshold, it may trigger further downward momentum possibly targeting lower support levels.
Assessing Price Downtrends: Are We Facing a 62% Correction?
The prevailing bullish sentiment surrounding HBAR could see it challenging its key resistance levels at $0.157 and $0.1711. However, technical indicators hint at a potential reversal, and market participants should remain vigilant about upcoming price actions.
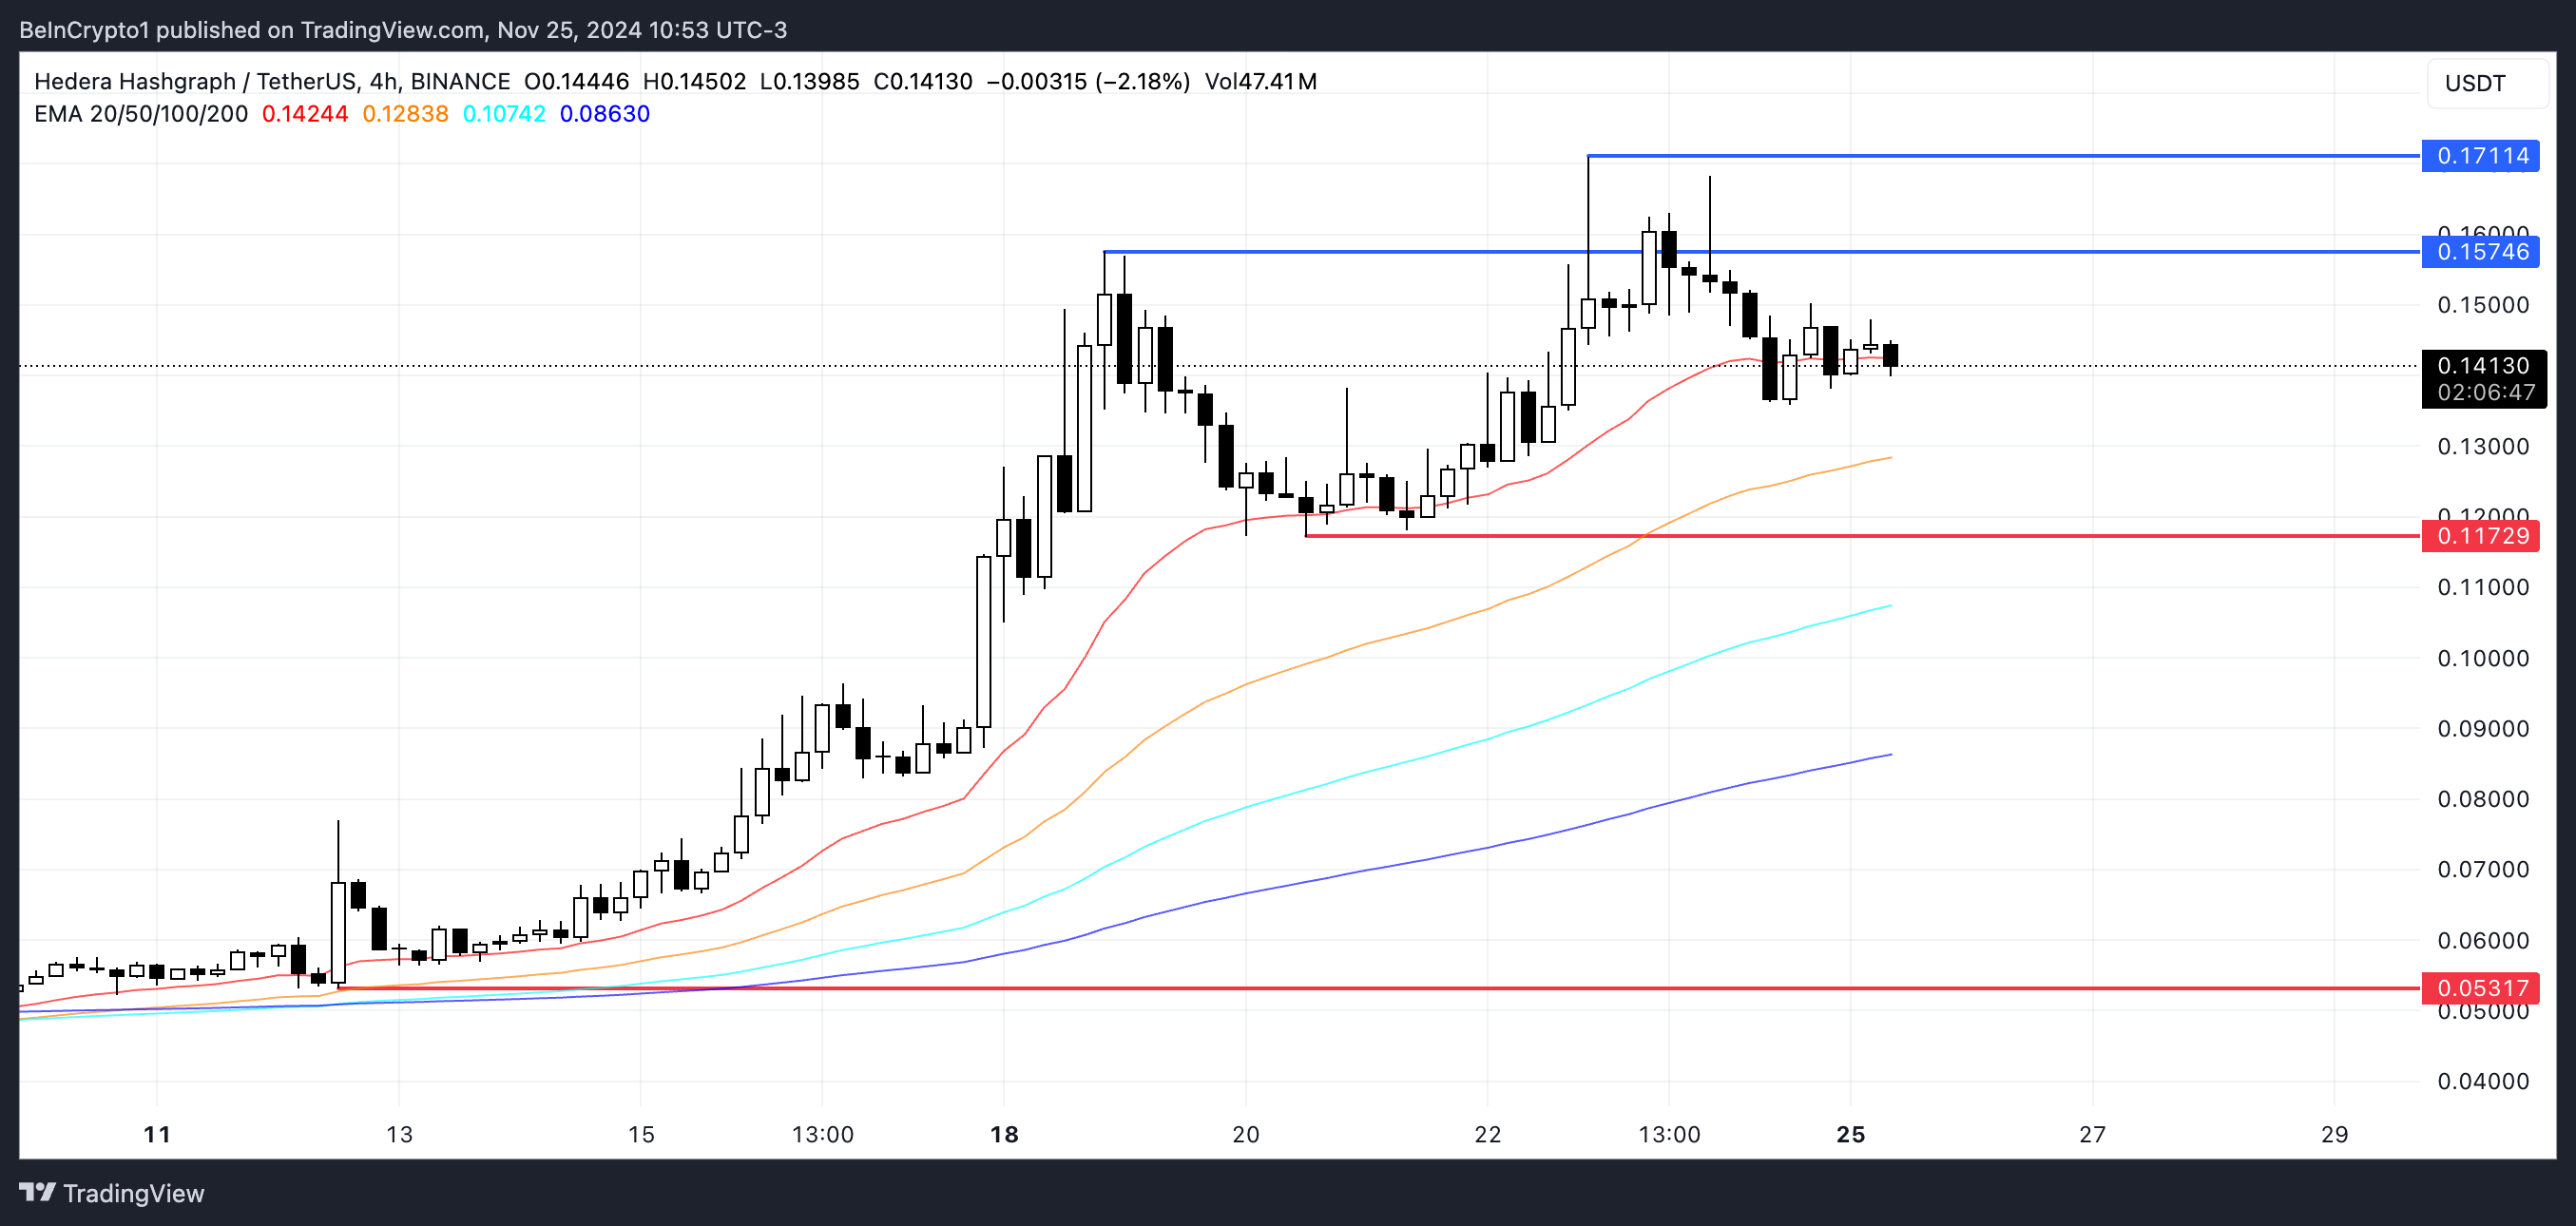
Should bearish momentum gain traction, HBAR is set to test the critical support levels at $0.117 and possibly drop as low as $0.053, indicating a potential correction of around 62%. This represents a significant concern for traders and investors who are closely monitoring market oscillations.
Conclusion
In summary, while HBAR’s recent rally reflects strong market performance driven by positive signals in its EMA and ADX trends, caution is warranted. The evolving dynamics indicated by the Ichimoku Cloud and DMI suggest potential volatility ahead. Investors should remain informed on these key indicators as HBAR navigates through critical support and resistance levels, planning accordingly to protect their investments.

