
XRP Rallies to 6-Years High of $2.49, Backed by Ripple Whales and Retail Frenzy

Ripple’s price has spiked by nearly 30%, reaching $2.49. Is this the start of a new era for XRP, or just a short-term surge?
Ripple (XRP) has skyrocketed to a six-year high of $2.49, climbing nearly 30% in the past 24 hours. This price surge is a major milestone for XRP, which has faced challenges maintaining consistent uptrends since Ripple’s legal battle with the SEC began four years ago.
As XRP breaks through key resistance levels, questions arise about the cause of this sudden rally. Is it the beginning of a new chapter for the altcoin, or merely a short-lived surge? This on-chain analysis explores the factors behind the spike and its potential implications for XRP’s future.
Ripple Sees $1.66 Billion Accumulation, Holders All-Time High
About one month ago, XRP’s price was $0.50, with little to no signs of rallying to $1, not to mention the recent rise above $2. However, today, the altcoin’s value is up 355% from that point, with its market cap hitting $133 billion and surpassing that of Solana (SOL) and Tether (USDT).
According to BeInCrypto’s findings and data obtained from Santiment, this rally could be linked to notable whale activity. Over the last three weeks, wallets holding between 1 million and 10 million tokens have accumulated a total of $697.1 million XRP within the last three weeks.
At the altcoin’s current value, this is worth $1.66 billion, indicating that Ripple whales played a huge role in the XRP price spike by increasing buying pressure.
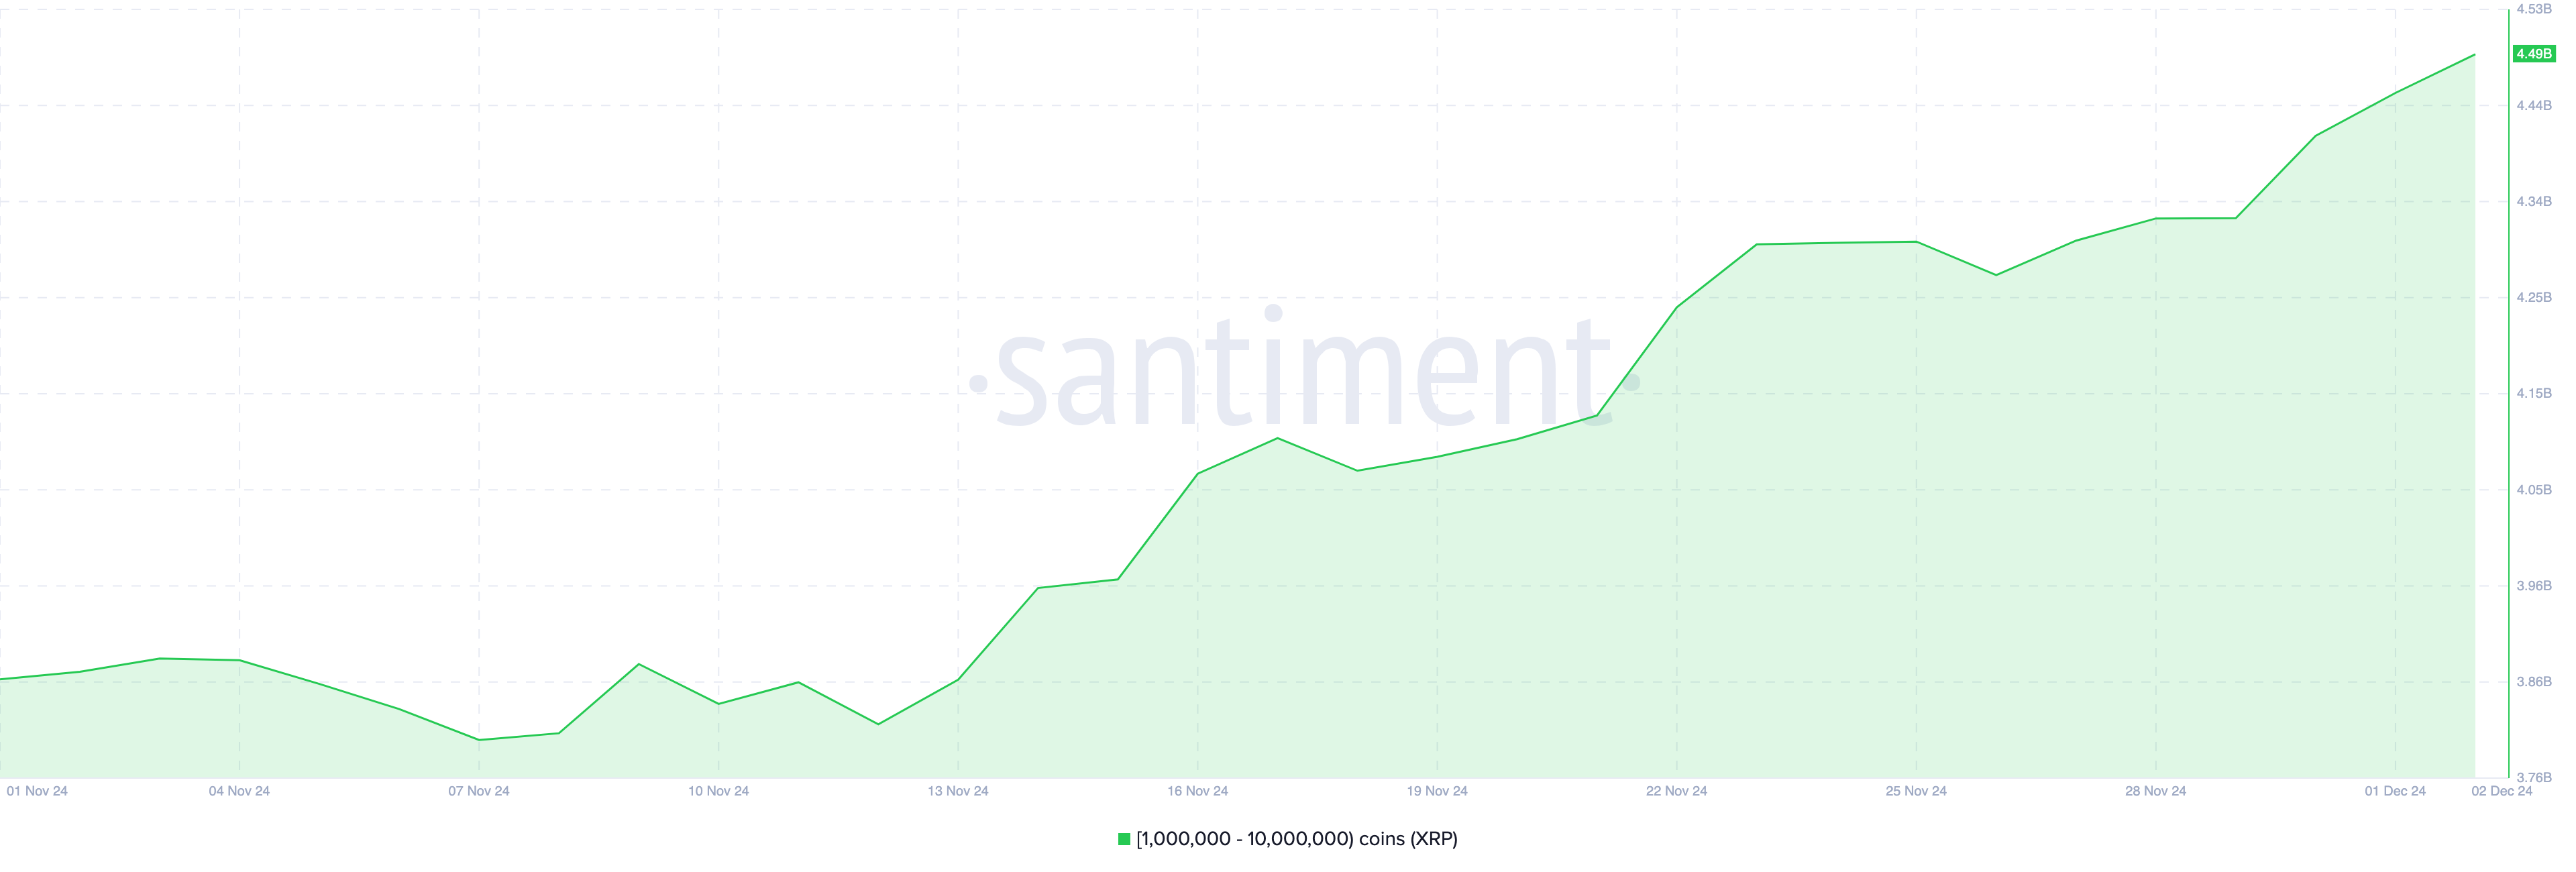 Ripple Whales Accumulation. Source:
Santiment
Ripple Whales Accumulation. Source:
Santiment
However, on-chain data reveals that crypto whales aren’t the only ones driving XRP’s recent surge. Sentiment data also highlights significant involvement from retail investors.
Notably, the total number of XRP wallets has reached an all-time high of 5.5 million, indicating that many previously inactive wallets are now holding balances. This trend is further supported by network growth, which measures new addresses completing their first transactions.
In October, network growth was under 9,000, but it has surged to 54,700 as of this writing. This substantial increase suggests a rise in adoption and activity on the XRP Ledger. If this momentum continues, the XRP price rally could persist, even after the recent dip to $2.35.
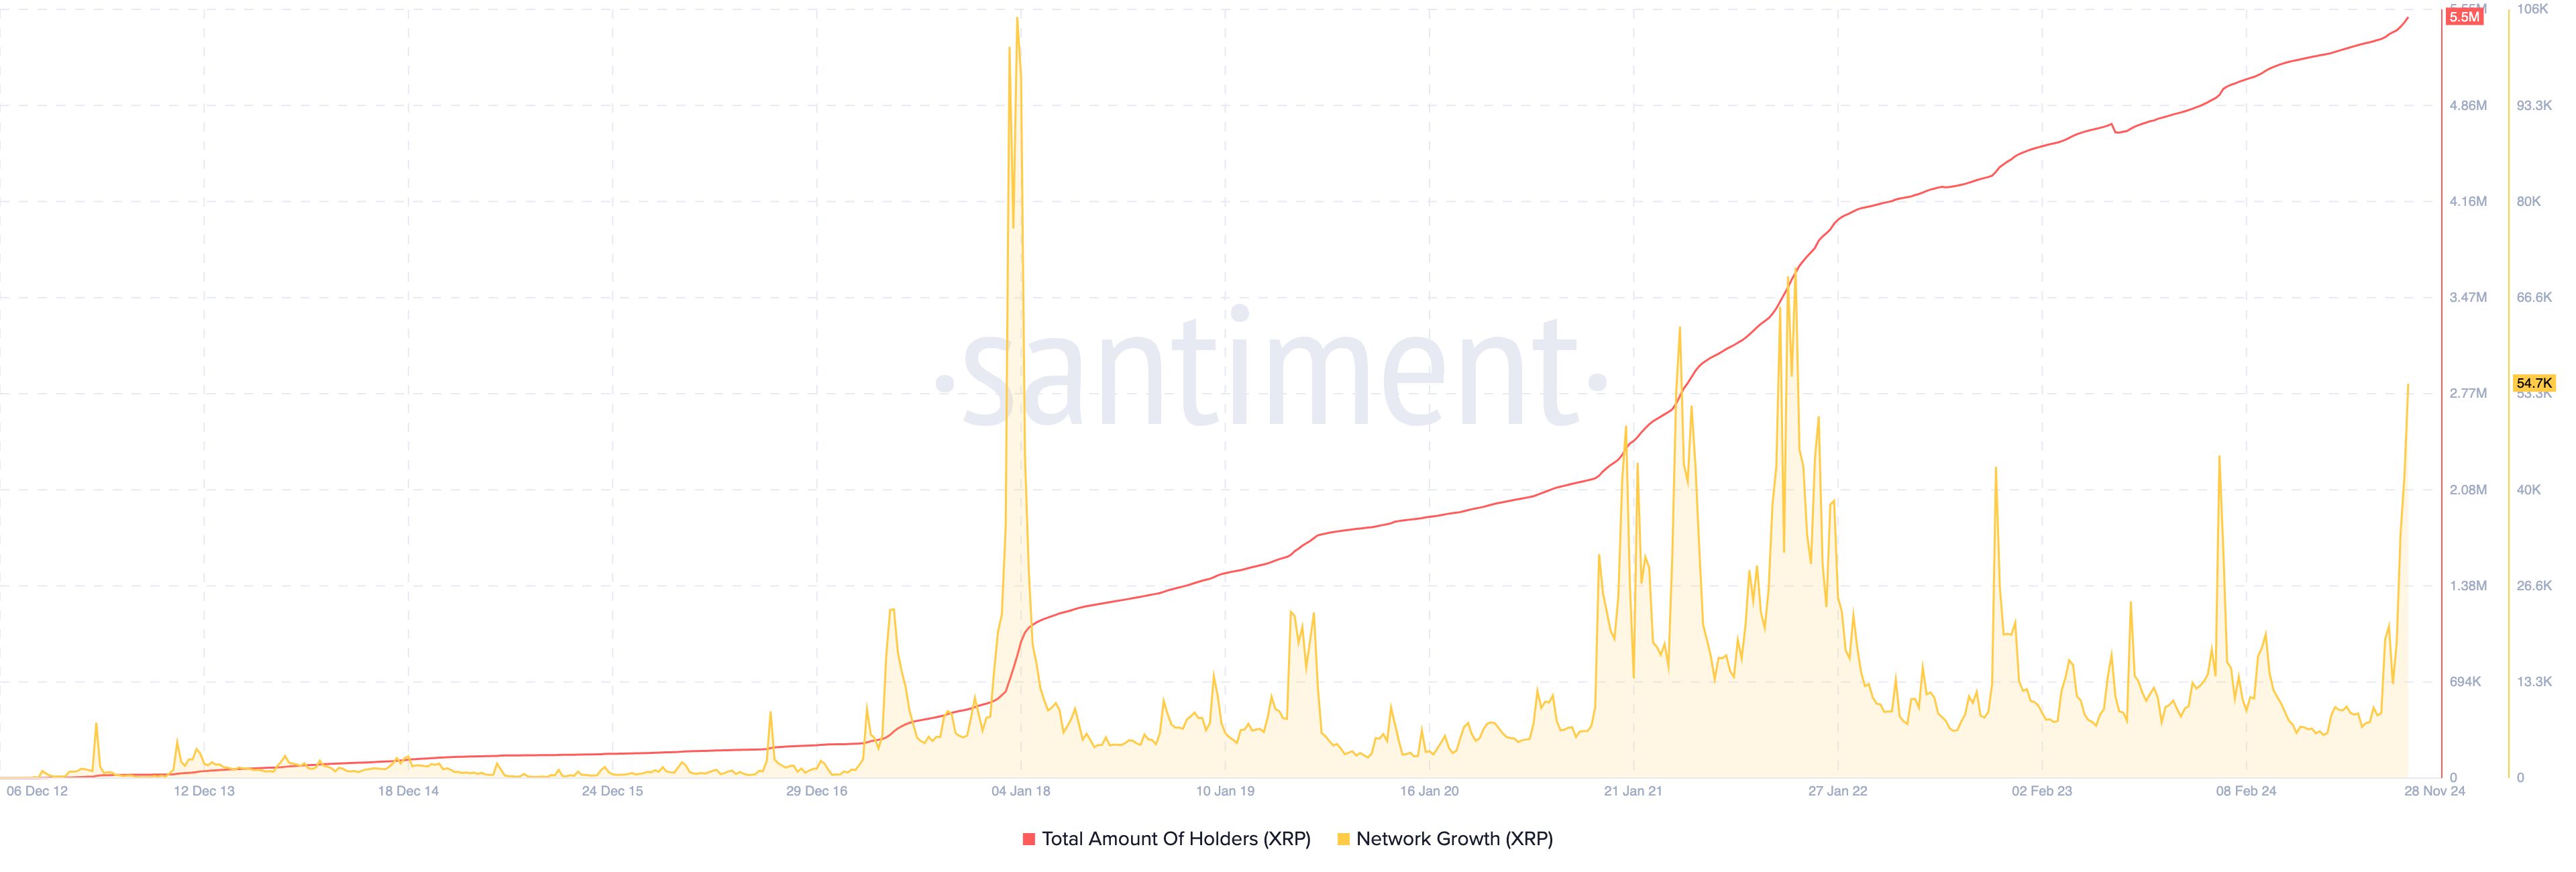 Ripple Network Growth. Source:
Santiment
Ripple Network Growth. Source:
Santiment
XRP Price Prediction: Is $3 Feasible?
On the daily chart, the Moving Average Convergence Divergence (MACD) has remained in the positive region. The MACD measures momentum. When it is positive, momentum is bullish, and when it is negative, momentum is bearish.
Therefore, the positive reading indicates that the momentum around XRP is positive. If sustained, this could drive the altcoin’s price higher. Another indicator fueling the upswing is the Ichimoku Cloud, which indicates support or resistance.
When the cloud is above the price, it indicates resistance, and the price can decrease. But in this case, it is below XRP’s price. Hence, the value might continue to surge, probably toward $3.
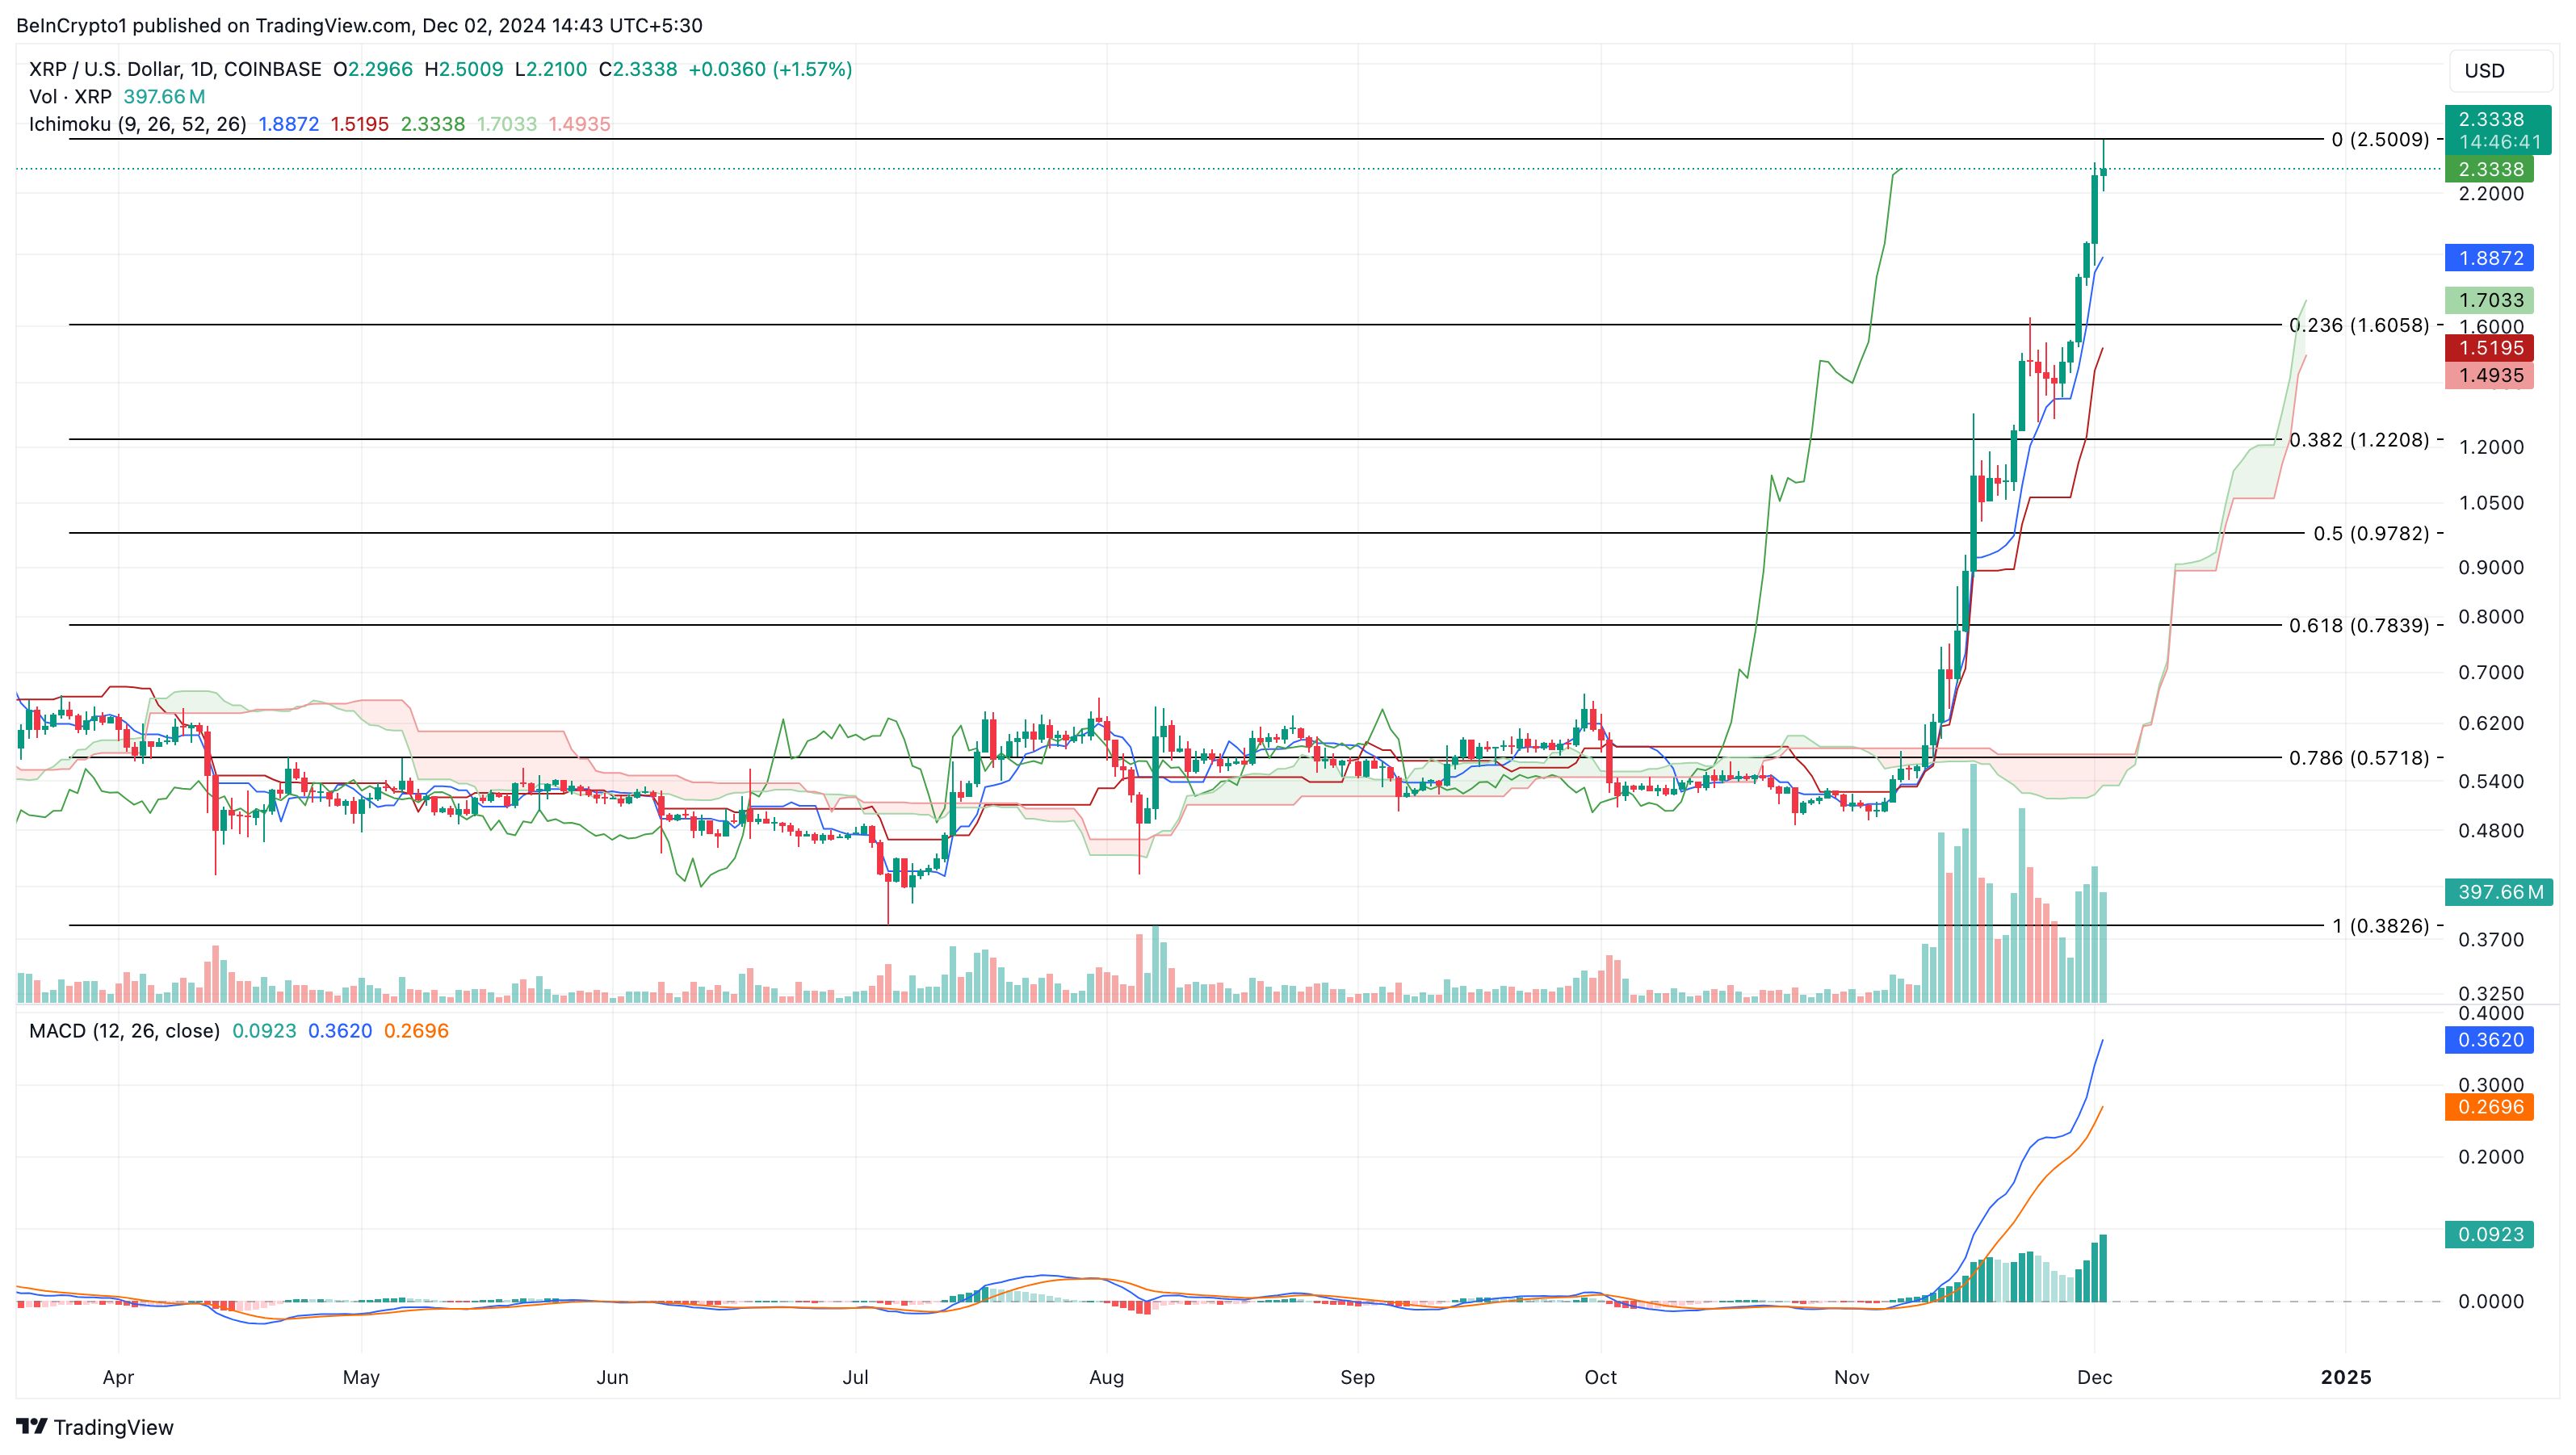 Ripple Daily Analysis. Source:
TradingView
Ripple Daily Analysis. Source:
TradingView
On the other hand, if XRP gets overbought or whales start to book profits, this might not happen. In that scenario, the altcoin’s value could decrease to $1.61.
Disclaimer: The content of this article solely reflects the author's opinion and does not represent the platform in any capacity. This article is not intended to serve as a reference for making investment decisions.
You may also like
New spot margin trading pair — HOLO/USDT!
FUN drops by 32.34% within 24 hours as it faces a steep short-term downturn
- FUN plunged 32.34% in 24 hours to $0.008938, marking a 541.8% monthly loss amid prolonged bearish trends. - Technical breakdowns, elevated selling pressure, and forced liquidations highlight deteriorating market sentiment and risk-off behavior. - Analysts identify key support below $0.0080 as critical, with bearish momentum confirmed by RSI (<30) and MACD indicators. - A trend-following backtest strategy proposes short positions based on technical signals to capitalize on extended downward trajectories.

OPEN has dropped by 189.51% within 24 hours during a significant market pullback
- OPEN's price plummeted 189.51% in 24 hours to $0.8907, marking its largest intraday decline in history. - The token fell 3793.63% over 7 days, matching identical monthly and yearly declines, signaling severe bearish momentum. - Technical analysts cite broken support levels and lack of bullish catalysts as key drivers of the sustained sell-off. - Absence of stabilizing volume or reversal patterns leaves the market vulnerable to further downward pressure.

New spot margin trading pair — LINEA/USDT!