
Macro Guru Raoul Pal Says Top Ethereum Rival Has a Massively Bullish Chart and Will Accelerate After Breakout

Former Goldman Sachs executive and macro expert Raoul Pal is leaning bullish on a large-cap Ethereum ( ETH ) competitor.
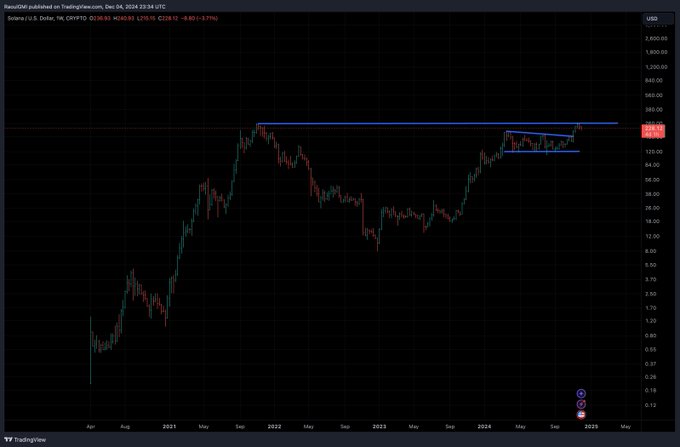
Pal tells his 1.1 million followers on the social media platform X that there “literally couldn’t be a more bullish long-term chart” than that of Solana ( SOL ) on the weekly time frame.
“When it breaks higher, it’s going to ACCELERATE.”
 Source: Raoul Pal/X
Based on Pal’s one-week chart, it appears that the macro guru is suggesting that Solana broke out of a descending channel and is now targeting to go above the resistance level around the all-time high price of just above $260.
Solana is trading at $240 at time of writing.
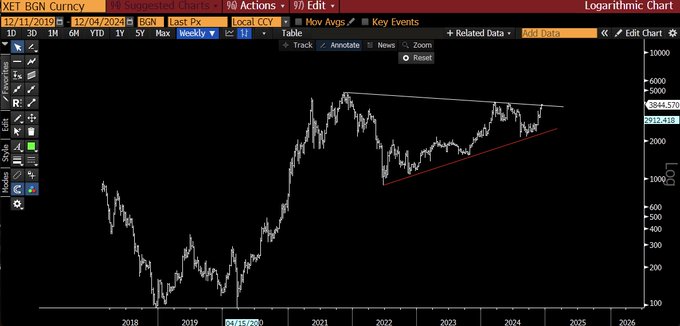
Next up is Ethereum. According to the former Goldman Sachs executive, Ethereum will experience a “spectacular” rally if and when it breaks out above the upper boundary of a symmetrical triangle pattern that has formed on the weekly time frame. In technical analysis, a symmetrical triangle pattern is bullish if the price breaks out of the upper border.
According to Pal, Ethereum has two options going forward.
“Maybe it pulls back first to gather steam or maybe it sails straight through.”
 Source: Raoul Pal/X
Ethereum is trading at $3,913 at time of writing.
Don't Miss a Beat – Subscribe to get email alerts delivered directly to your inboxCheck Price Action
Follow us on X , Facebook and Telegram
Surf The Daily Hodl Mix
Generated Image: Midjourney
Disclaimer: The content of this article solely reflects the author's opinion and does not represent the platform in any capacity. This article is not intended to serve as a reference for making investment decisions.
You may also like
New spot margin trading pair — HOLO/USDT!
FUN drops by 32.34% within 24 hours as it faces a steep short-term downturn
- FUN plunged 32.34% in 24 hours to $0.008938, marking a 541.8% monthly loss amid prolonged bearish trends. - Technical breakdowns, elevated selling pressure, and forced liquidations highlight deteriorating market sentiment and risk-off behavior. - Analysts identify key support below $0.0080 as critical, with bearish momentum confirmed by RSI (<30) and MACD indicators. - A trend-following backtest strategy proposes short positions based on technical signals to capitalize on extended downward trajectories.

OPEN has dropped by 189.51% within 24 hours during a significant market pullback
- OPEN's price plummeted 189.51% in 24 hours to $0.8907, marking its largest intraday decline in history. - The token fell 3793.63% over 7 days, matching identical monthly and yearly declines, signaling severe bearish momentum. - Technical analysts cite broken support levels and lack of bullish catalysts as key drivers of the sustained sell-off. - Absence of stabilizing volume or reversal patterns leaves the market vulnerable to further downward pressure.

New spot margin trading pair — LINEA/USDT!