
Uniswap (UNI) Surges Past $10 Billion Market Cap With More Room to Grow

Uniswap (UNI) gains 80.44% in a month, crossing a $10 billion market cap. RSI and ADX trends suggest room for growth toward $20.
Uniswap (UNI) price has seen impressive growth, crossing the $10 billion market cap and rising 80.44% in the last 30 days. With the price currently at 67 on the Relative Strength Index (RSI), UNI is approaching overbought territory but still has room to grow before signaling an immediate correction.
Despite a slight dip in the Average Directional Index (ADX) from 46 to 39, UNI remains in a strong uptrend with a trend strength above 25. If the uptrend continues, UNI could test the resistance at $17.39, potentially reaching $20, its highest price since 2021.
UNI RSI Is Still Below Overbought Zone
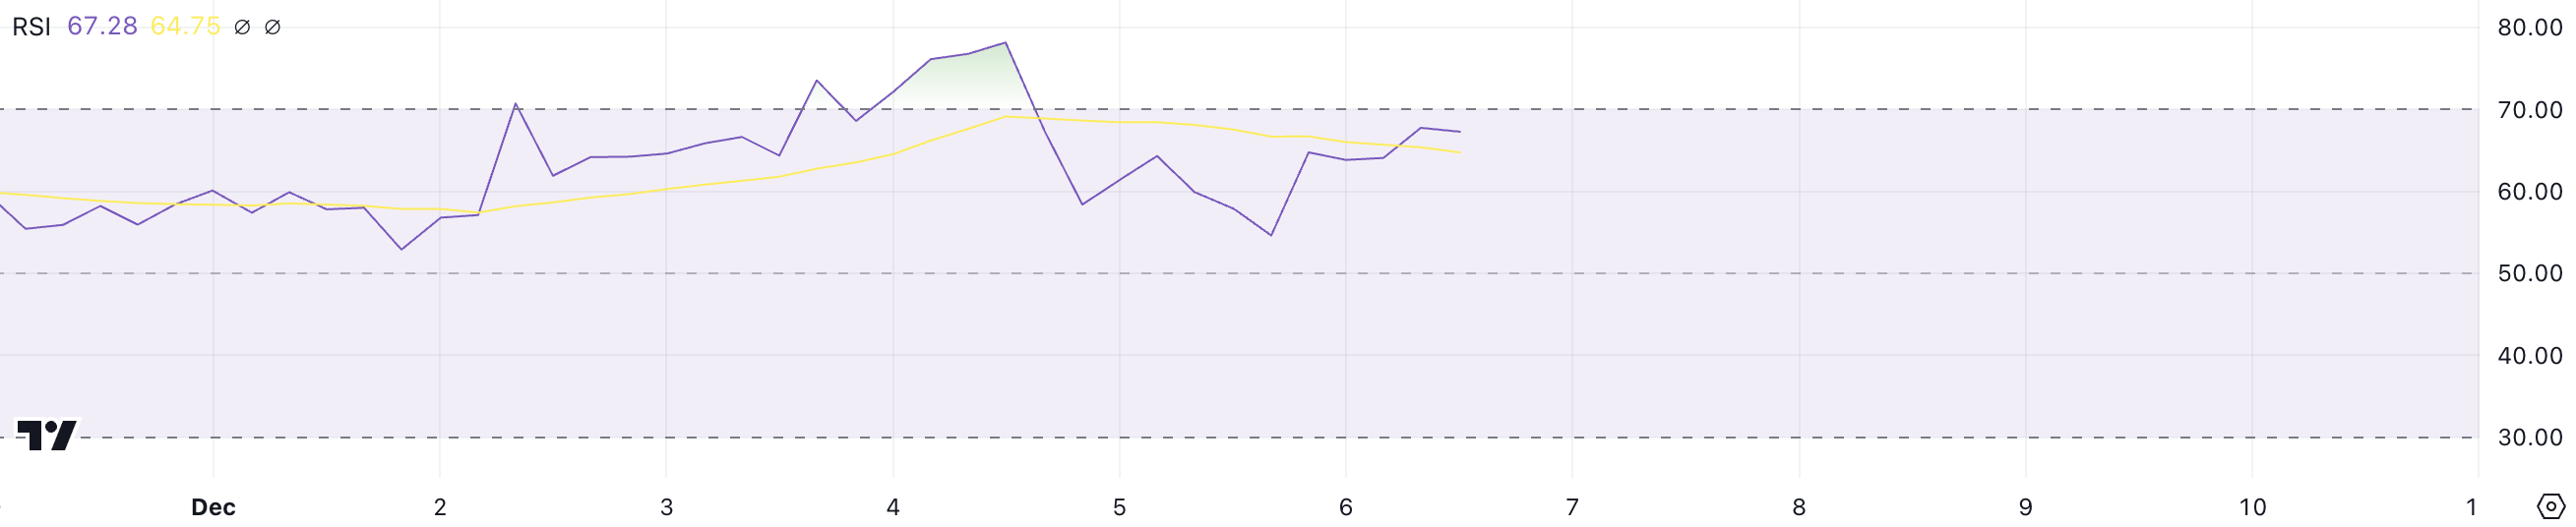
Uniswap RSI is currently at 67, meaning it is approaching overbought territory but hasn’t yet reached the 70 mark.
RSI values above 70 typically suggest the asset is overbought, but at 67, UNI still has room to grow without signaling an immediate correction.
 UNI RSI. Source:
TradingView
UNI RSI. Source:
TradingView
RSI measures price momentum on a scale from 0 to 100, with values above 70 indicating overbought conditions and below 30 suggesting oversold conditions.
Since UNI RSI stayed above 70 during recent price spikes, the current level of 67 shows there is still potential for growth before a correction might occur.
Uniswap ADX Shows the Current Uptrend Is Strong
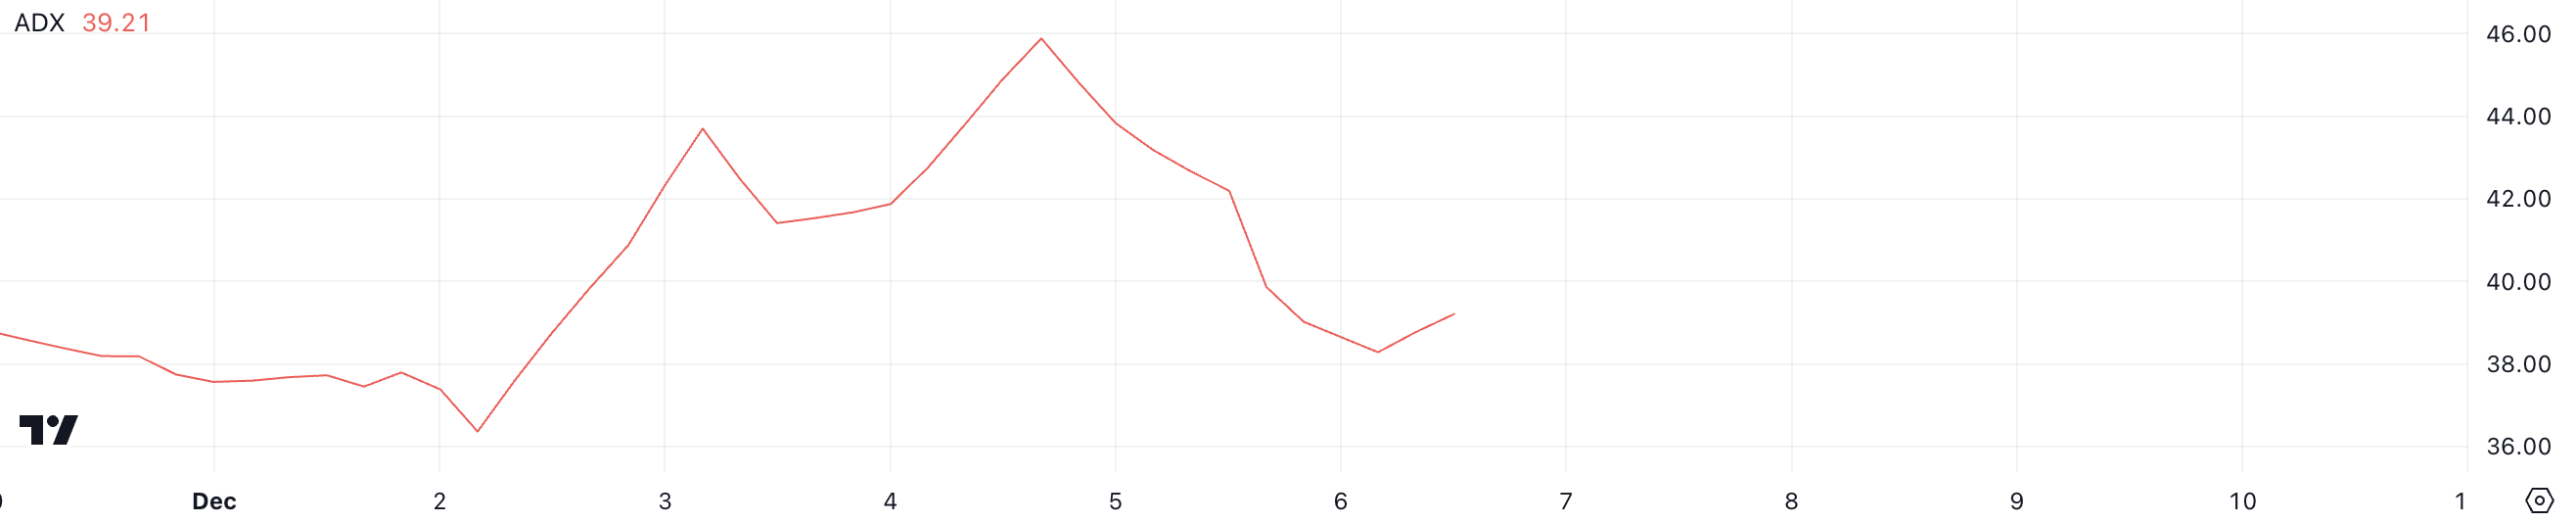
UNI’s ADX is currently at 39, down from 46 just two days ago, indicating a slight decrease in trend strength.
While this drop suggests a reduction in momentum, the ADX still remains above 25, which signals that UNI price is in a strong trend, despite the recent pullback.
 UNI ADX. Source:
TradingView.
UNI ADX. Source:
TradingView.
The Average Directional Index (ADX) measures the strength of a trend, with values above 25 indicating a strong trend and values below 20 suggesting weak or no trend.
Since UNI’s ADX is at 39, it shows that the asset is still in a strong uptrend, although the recent decrease suggests a potential slowdown in momentum. The ADX at 39 indicates that UNI bullish trend remains intact, but there may be a brief consolidation before further gains.
UNI Price Prediction: Can It Rise Back to $20 After 3 Years?
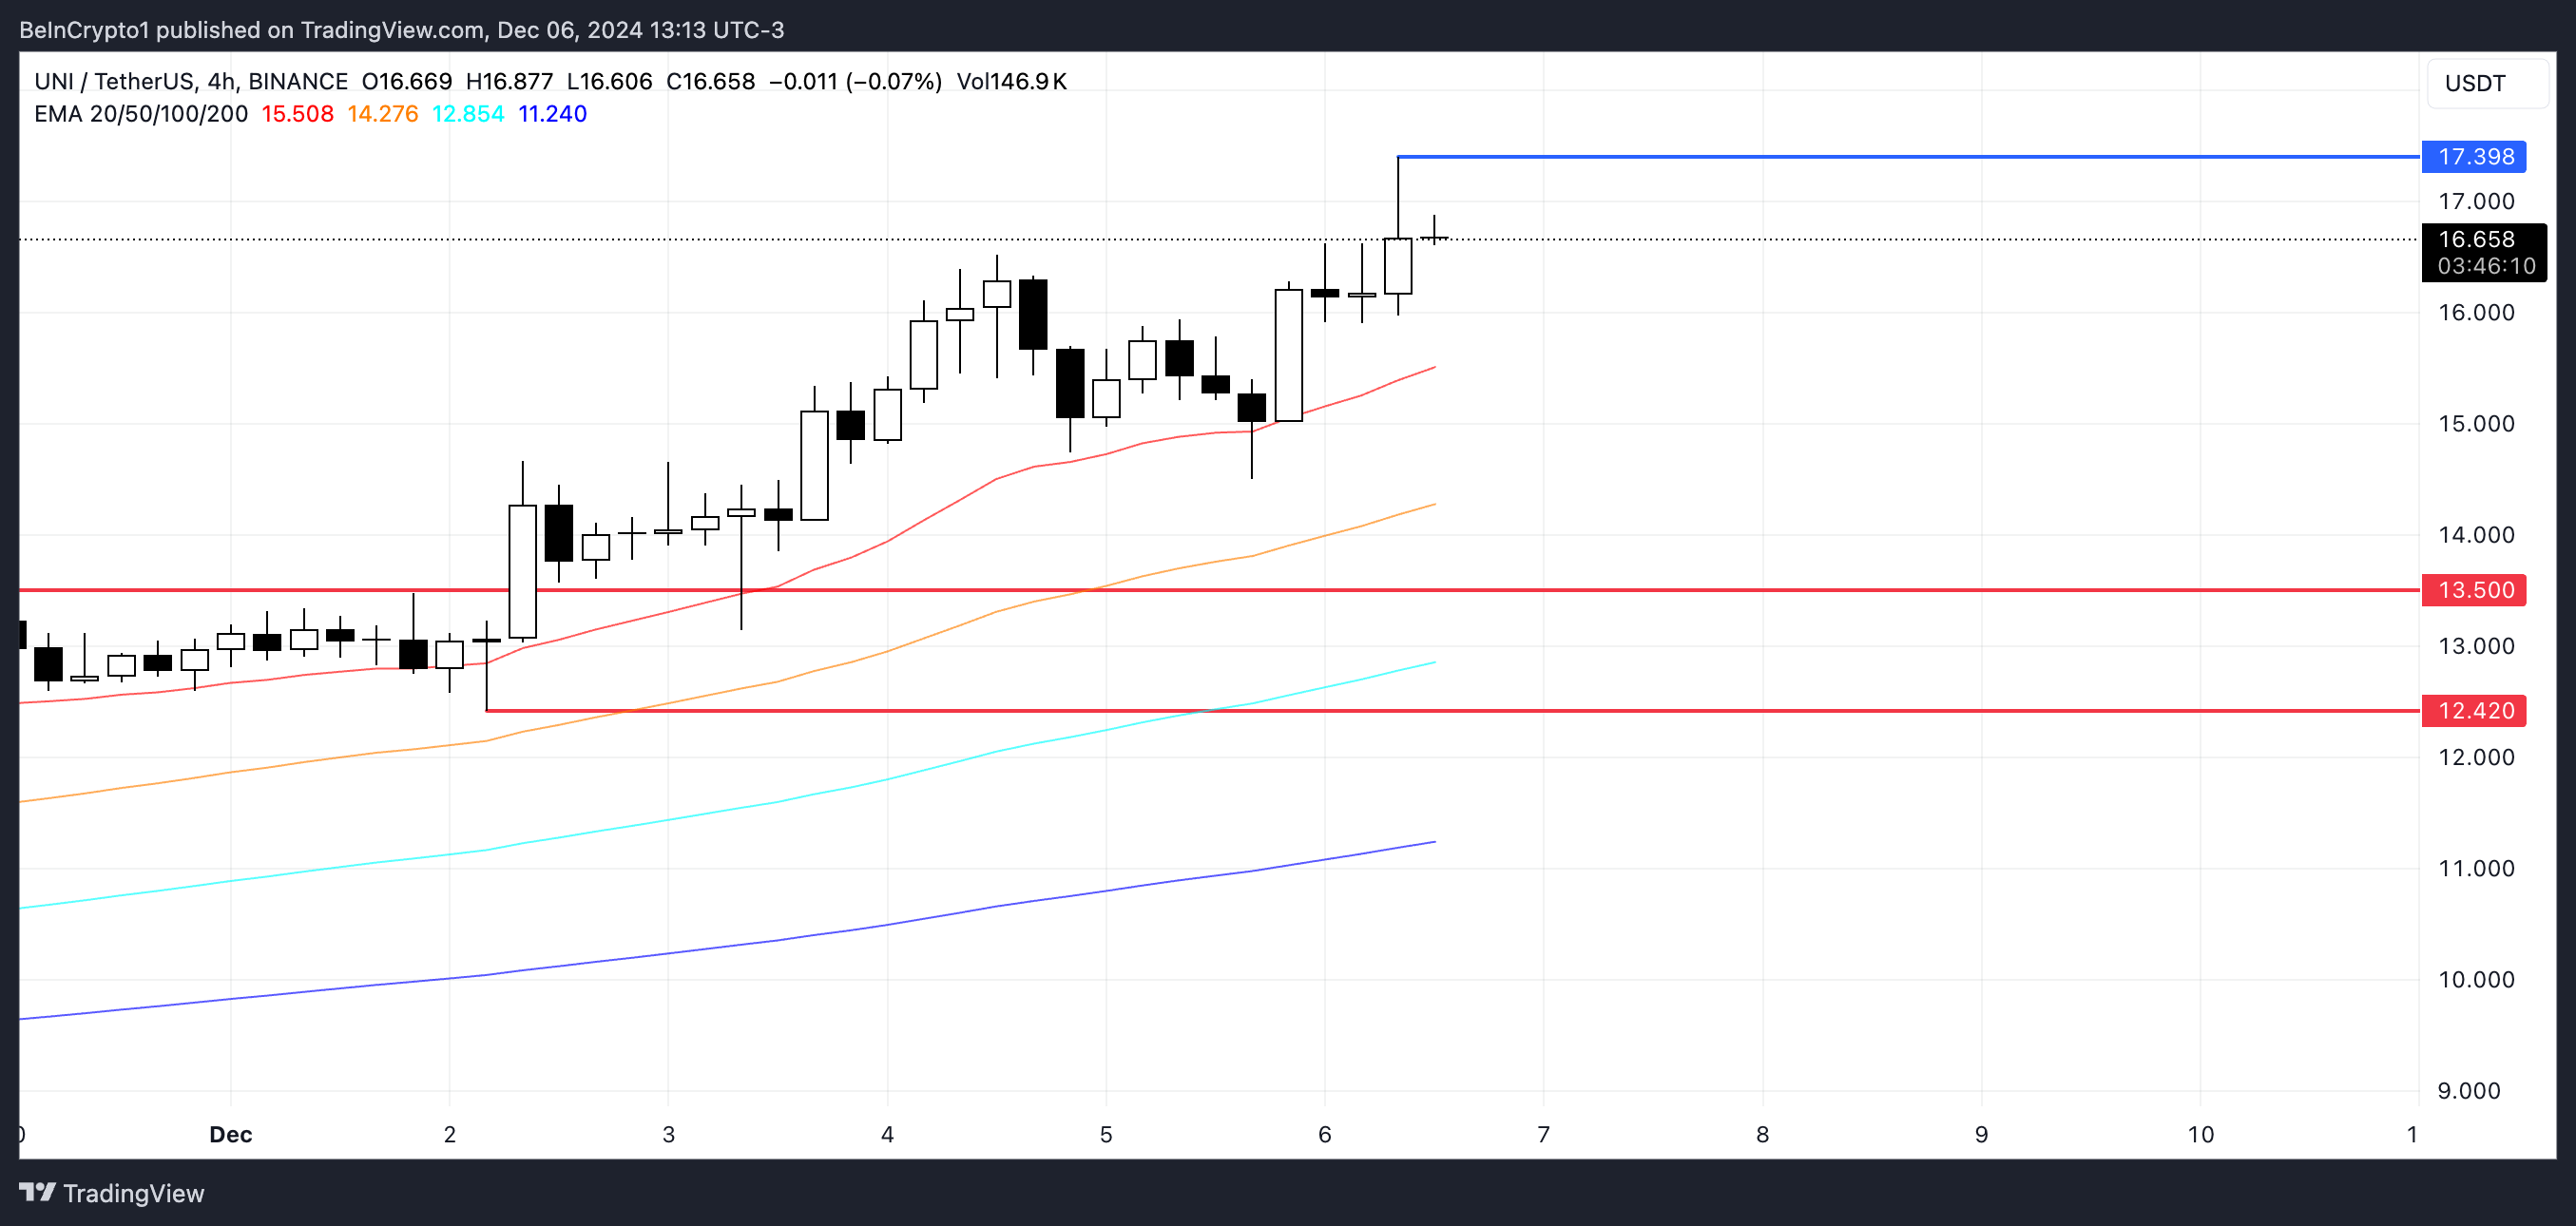
If the uptrend continues, UNI price could test the resistance at $17.39 and potentially rise up to $20, marking its highest price since 2021.
This would signal a strong continuation of the bullish momentum, with Uniswap price aiming for significant gains.
 UNI Price Analysis. Source:
TradingView
UNI Price Analysis. Source:
TradingView
However, if the current trend reverses, Uniswap price could test the first support level around $13.5. If this support fails to hold, the price could drop further, potentially reaching as low as $12.4, indicating a bearish shift if the trend doesn’t regain strength.
Disclaimer: The content of this article solely reflects the author's opinion and does not represent the platform in any capacity. This article is not intended to serve as a reference for making investment decisions.
You may also like
New spot margin trading pair — HOLO/USDT!
FUN drops by 32.34% within 24 hours as it faces a steep short-term downturn
- FUN plunged 32.34% in 24 hours to $0.008938, marking a 541.8% monthly loss amid prolonged bearish trends. - Technical breakdowns, elevated selling pressure, and forced liquidations highlight deteriorating market sentiment and risk-off behavior. - Analysts identify key support below $0.0080 as critical, with bearish momentum confirmed by RSI (<30) and MACD indicators. - A trend-following backtest strategy proposes short positions based on technical signals to capitalize on extended downward trajectories.

OPEN has dropped by 189.51% within 24 hours during a significant market pullback
- OPEN's price plummeted 189.51% in 24 hours to $0.8907, marking its largest intraday decline in history. - The token fell 3793.63% over 7 days, matching identical monthly and yearly declines, signaling severe bearish momentum. - Technical analysts cite broken support levels and lack of bullish catalysts as key drivers of the sustained sell-off. - Absence of stabilizing volume or reversal patterns leaves the market vulnerable to further downward pressure.

New spot margin trading pair — LINEA/USDT!