
Will Cardano Price Mimic 2020 Rally to Hit $6?

The crypto market recorded a notable downtick during Tuesday’s trading season as Bitcoin teased a breakdown below $95,000. This pullback has triggered a renewed correction whale in most major altcoins, including ADA. However, a crypto analyst reveals the Cardano price downturn resembles a part of the 2020 rally, indicating the potential for uptrend continuation.
By press time, the ADA price trades at $0.96 with an intraday loss of 3.63%. According to Coingecko, the asset’s market cap stands at $9.8 Billion, while the $13.1 Billion.
Key Highlights:
- The current Cardno price trajectory resembling the 2020 rally hints at an occasional pullback for buyers to revive bullish momentum.
- Crypto analyst the post-correction rally could drive the asset around $4 to $6 target.
- The $0.83 floor, backed by a 0.5 FIB level and 50-day exponential moving average, creates a strong pullback support.
Cardano Price Drop Mirrors 2020 Pattern: Analyst Predicts $4-$6 Target
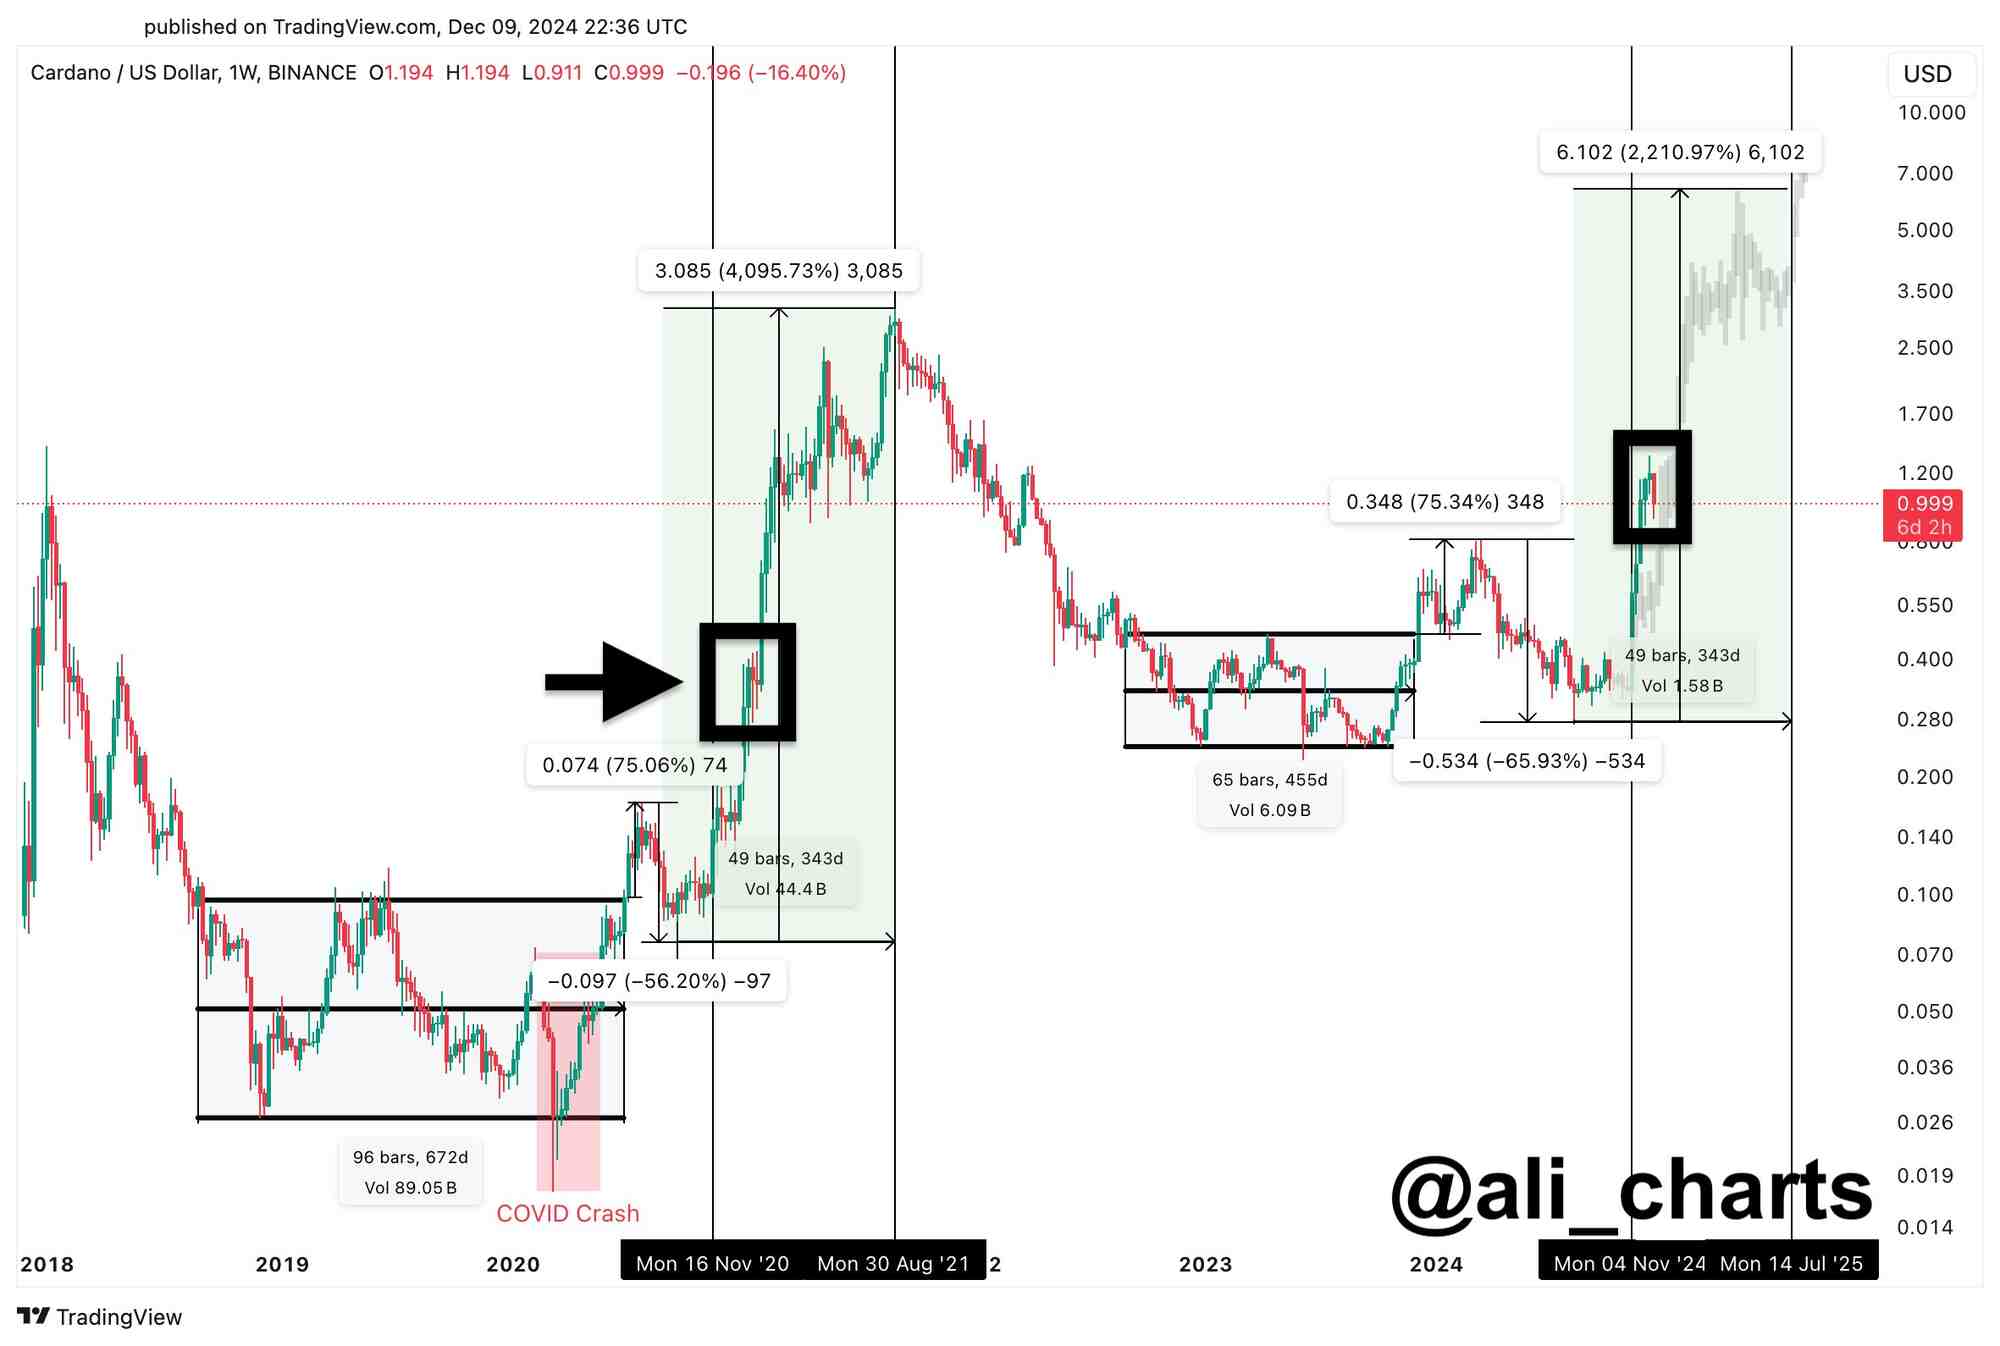
Amid the recent market downturn, the Cardano price showed a 4-day fall from $1.23 to $0.96, registering a 21% loss. While the downtick breaks the $1 psychological level, crypto analyst Ali Martinez stated, “Cardano is doing the same as it did in 2020,”
The chart added in his tweet shows the ADA entered a high-momentum rally in 2020 rally after a massive breakout from long-term accumulation. This uptrend witnessed in-between pullback to recuperate the exhausted bullish momentum.
Thus, the current pullback in ADA price is an occasional correction for buyers before the next trip. If the theory holds true, the analyst predicts a potential target of around $4 to $6.
Fibonacci Levels Signal Buyer Strength in ADA Price Action
According to the Fibonacci retracement level, the Cardano price is seeking support at 0.328 FIB level, around $0.94. Theoretically, the aforementioned falls under the safety net of FIB correction, indicating the buyers still have an upper hand in this asset.
A breakdown below $0.94 could extend the correction to $0.83, registering a 17% fall.
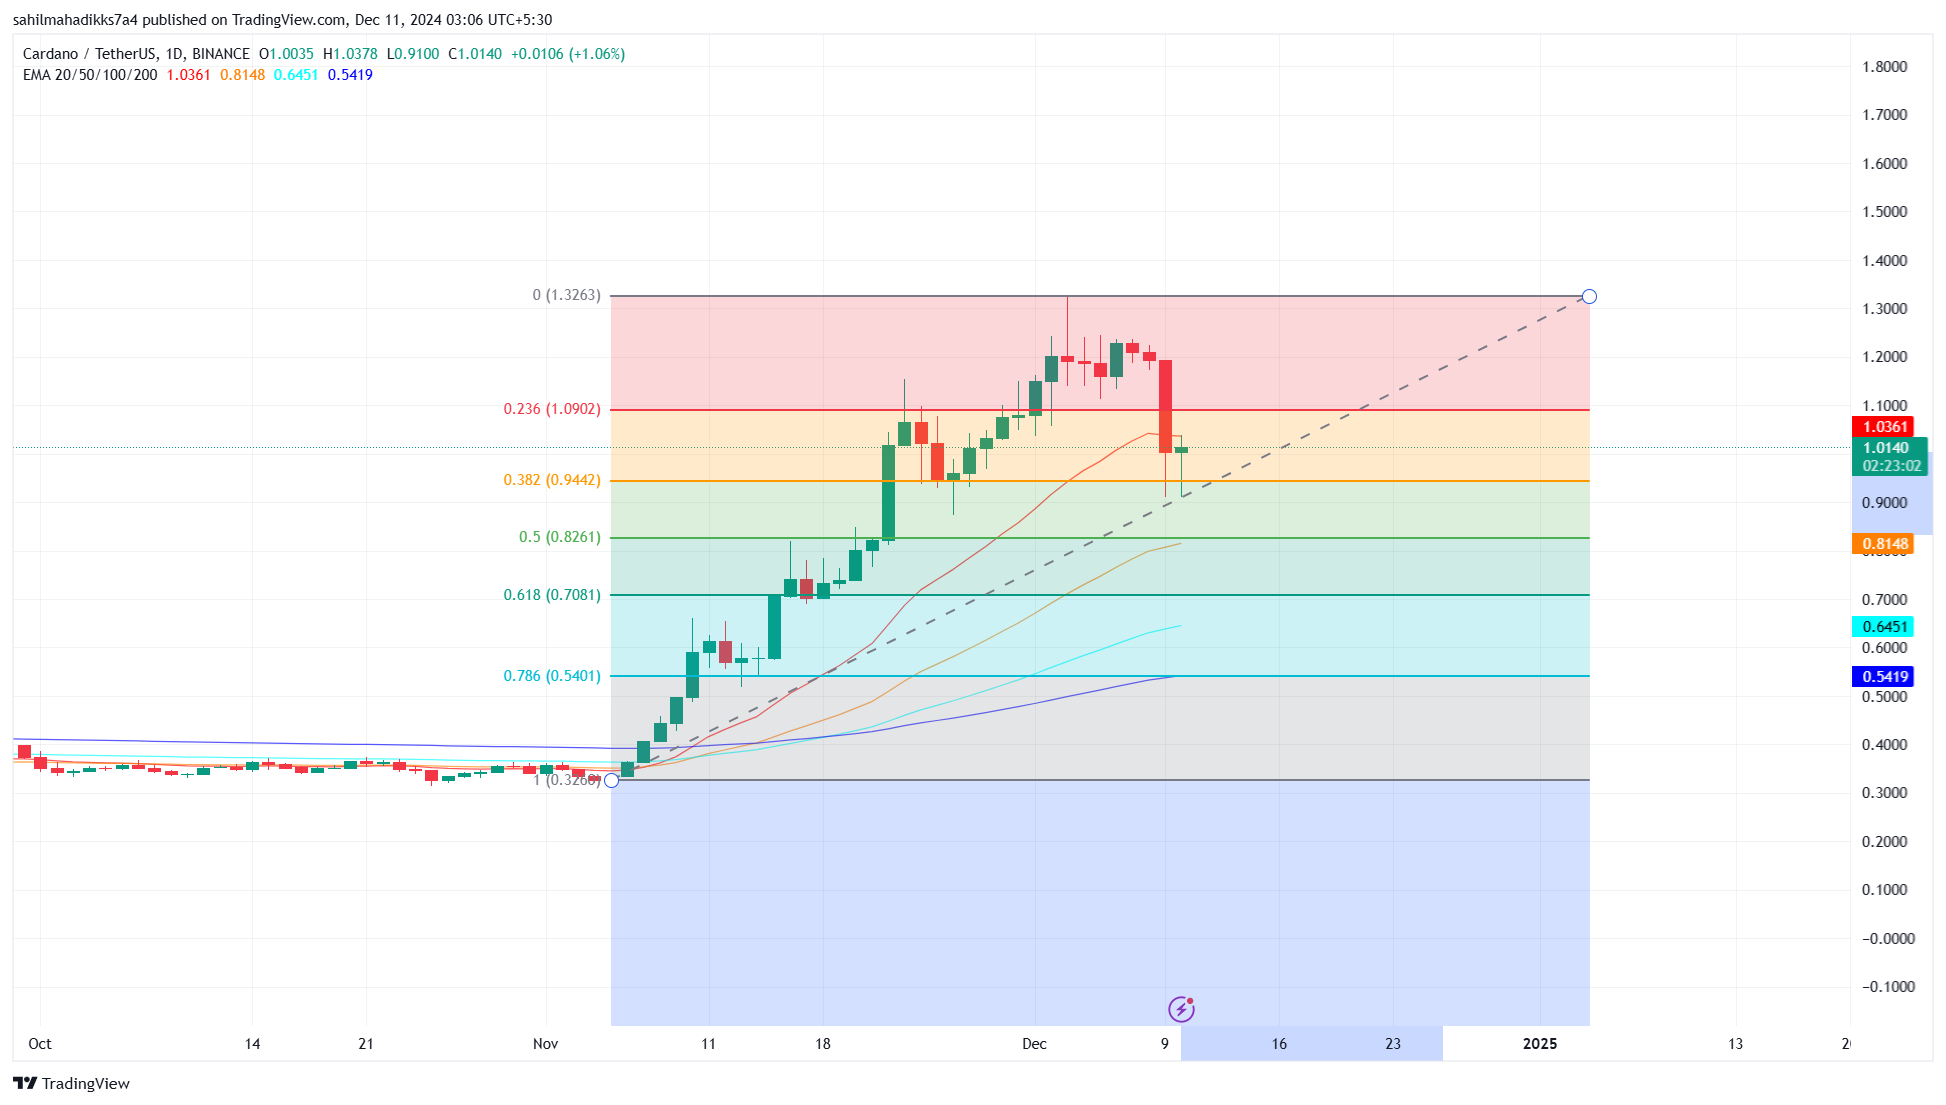
In addition, the ADA price trading above daily EMAs (50, 100, and 200) shows high momentum rally active in near ternm.
Disclaimer: The content of this article solely reflects the author's opinion and does not represent the platform in any capacity. This article is not intended to serve as a reference for making investment decisions.
You may also like
New spot margin trading pair — HOLO/USDT!
FUN drops by 32.34% within 24 hours as it faces a steep short-term downturn
- FUN plunged 32.34% in 24 hours to $0.008938, marking a 541.8% monthly loss amid prolonged bearish trends. - Technical breakdowns, elevated selling pressure, and forced liquidations highlight deteriorating market sentiment and risk-off behavior. - Analysts identify key support below $0.0080 as critical, with bearish momentum confirmed by RSI (<30) and MACD indicators. - A trend-following backtest strategy proposes short positions based on technical signals to capitalize on extended downward trajectories.

OPEN has dropped by 189.51% within 24 hours during a significant market pullback
- OPEN's price plummeted 189.51% in 24 hours to $0.8907, marking its largest intraday decline in history. - The token fell 3793.63% over 7 days, matching identical monthly and yearly declines, signaling severe bearish momentum. - Technical analysts cite broken support levels and lack of bullish catalysts as key drivers of the sustained sell-off. - Absence of stabilizing volume or reversal patterns leaves the market vulnerable to further downward pressure.

New spot margin trading pair — LINEA/USDT!