
Bitcoin Closing In on Greater Move to Massive Price Target, According to Trader Who Called 2021 Market Collapse

A veteran trader known for accurately calling the crypto market collapse of May 2021 believes Bitcoin ( BTC ) is gearing up for an explosive move.
Pseudonymous analyst Dave the Wave tells his 147,800 followers on the social media platform X that Bitcoin is trading in a narrow range, setting the flagship crypto asset up for a breakout.
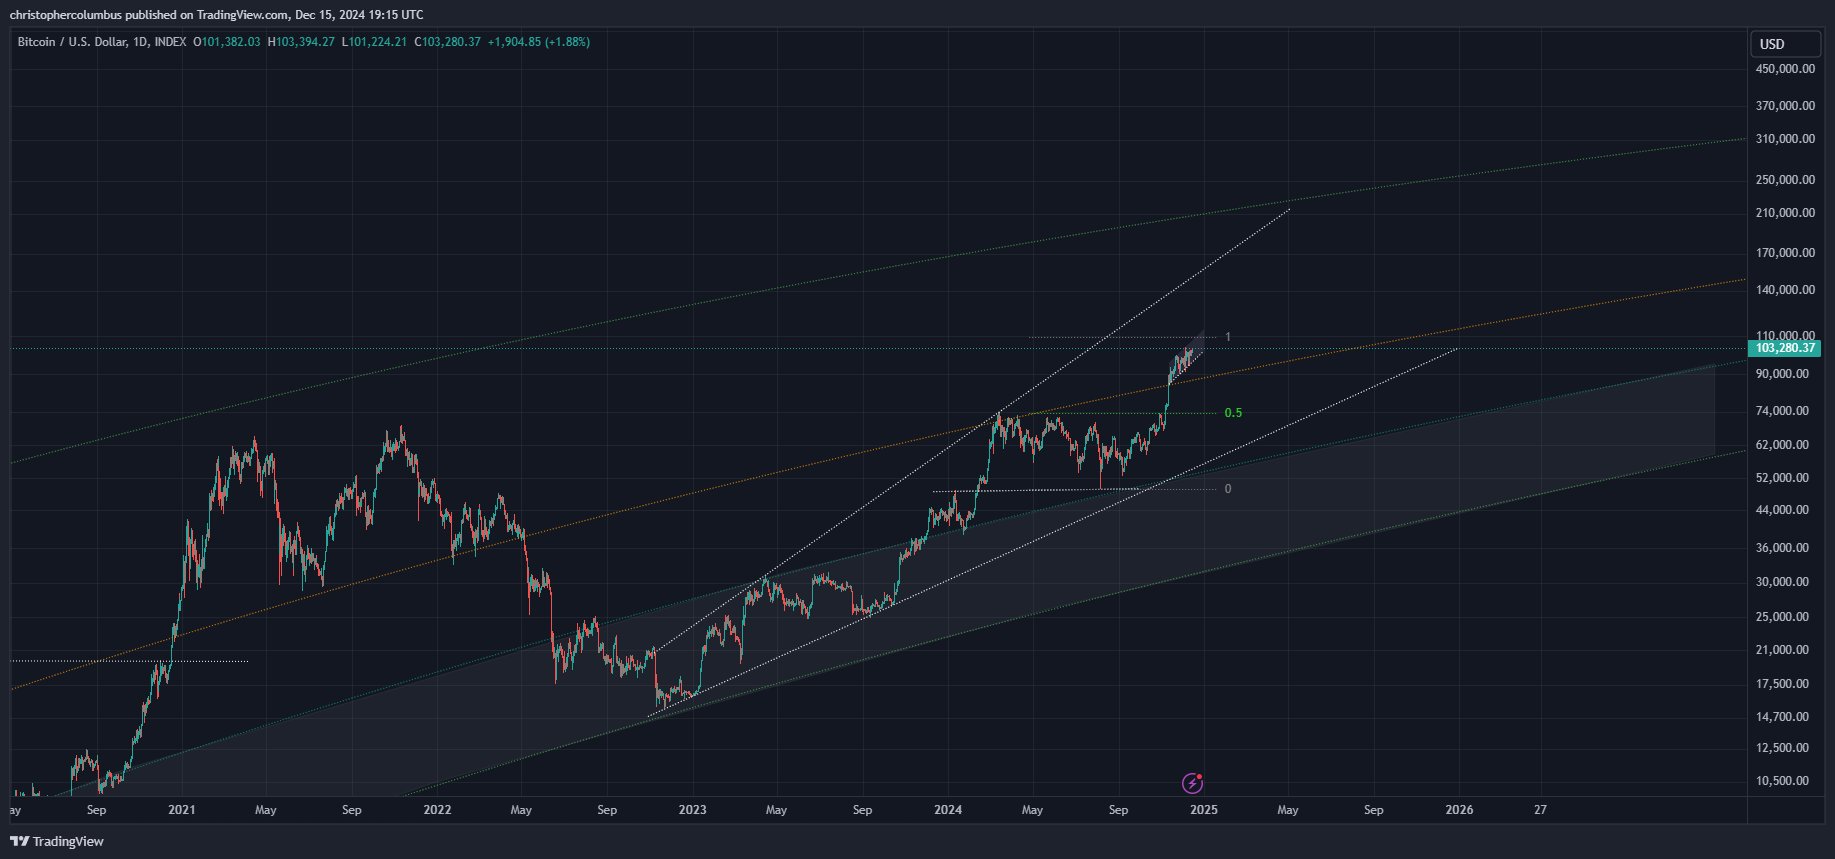
He also shares a chart using his version of the logarithmic growth channel (LGC) curve, which aims to predict Bitcoin’s longer-term cycle lows and highs while filtering out shorter-term volatility.
“BTC closing in on the shorter-term target on the chart for some time now. With price coiling, wouldn’t be surprised to see an even greater move in the upper half of the LGC [logarithmic growth] channel.”
 Source: Dave the Wave/X
Looking at his chart, a move closer to the upper bound of the LGC channel would repeat a similar pattern that occurred in the 2021 bull market cycle top.
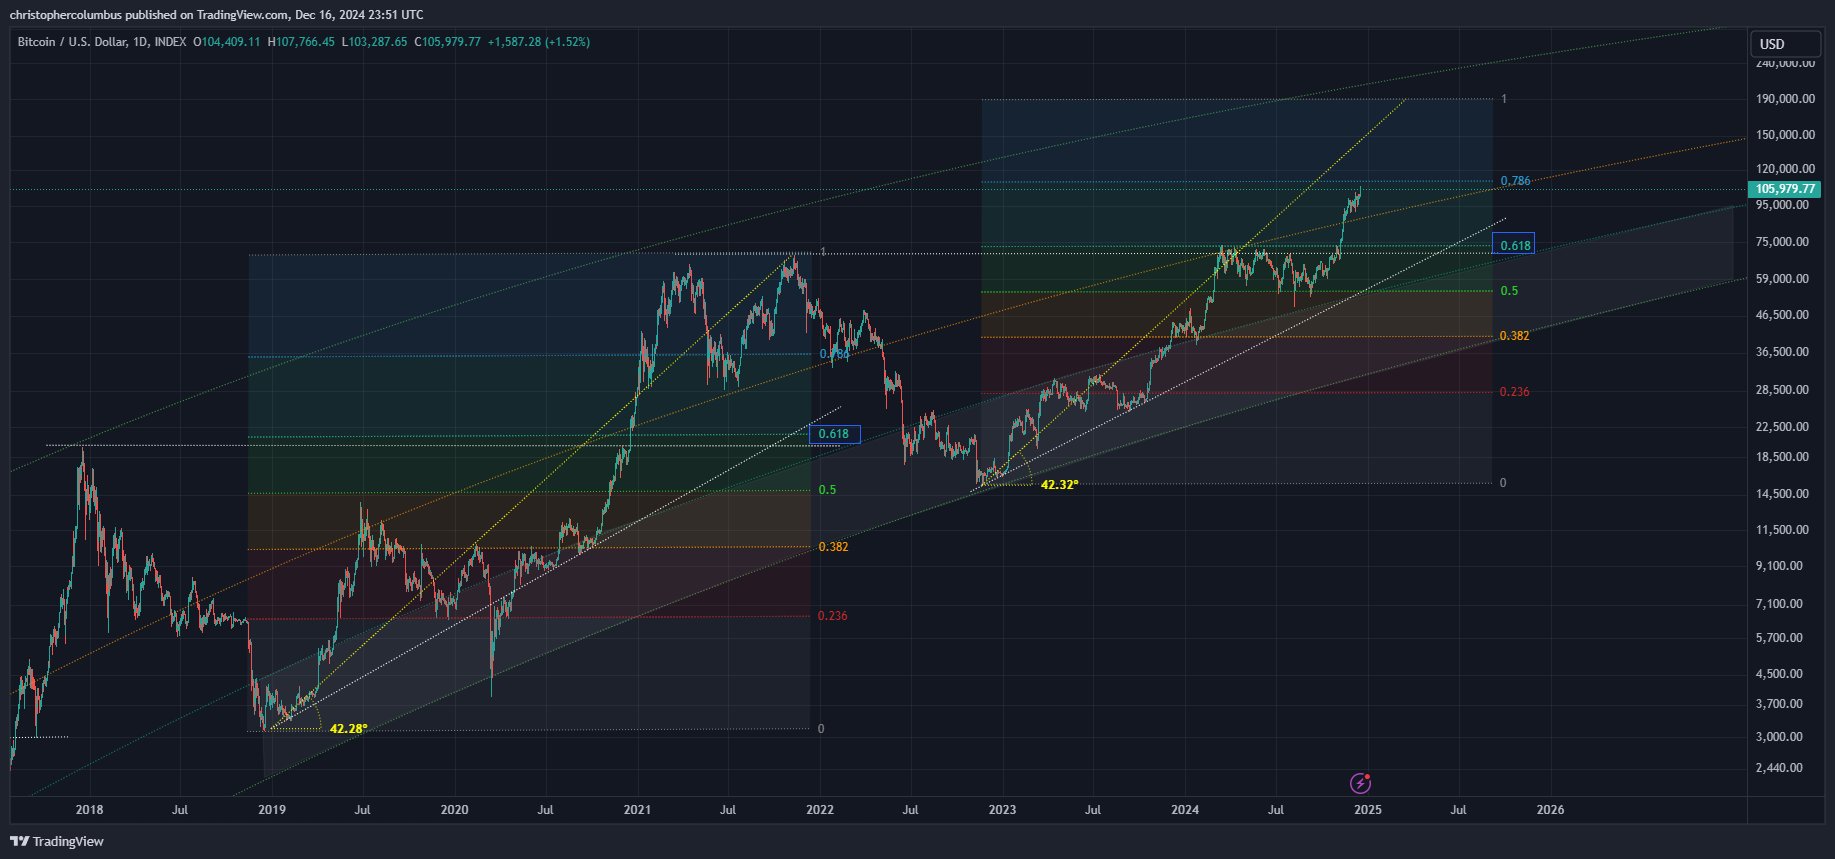
Next up, the analyst shares a chart of Bitcoin Fibonacci extension levels that suggest Bitcoin may rally to $190,000.
Traders use Fibonacci extensions in technical analysis to estimate profit targets and price pullbacks. They are based on Fibonacci ratios.
“One to post to those promoting regular [non-diminishing] BTC returns – the Fib comp shows the possibility of just the one more level to go.”
 Source: Dave the Wave/X
Bitcoin is trading for $106,124 at time of writing, flat on the day.
Don't Miss a Beat – Subscribe to get email alerts delivered directly to your inboxCheck Price Action
Follow us on X , Facebook and Telegram
Surf The Daily Hodl Mix
Generated Image: Midjourney
Disclaimer: The content of this article solely reflects the author's opinion and does not represent the platform in any capacity. This article is not intended to serve as a reference for making investment decisions.
You may also like
New spot margin trading pair — HOLO/USDT!
FUN drops by 32.34% within 24 hours as it faces a steep short-term downturn
- FUN plunged 32.34% in 24 hours to $0.008938, marking a 541.8% monthly loss amid prolonged bearish trends. - Technical breakdowns, elevated selling pressure, and forced liquidations highlight deteriorating market sentiment and risk-off behavior. - Analysts identify key support below $0.0080 as critical, with bearish momentum confirmed by RSI (<30) and MACD indicators. - A trend-following backtest strategy proposes short positions based on technical signals to capitalize on extended downward trajectories.

OPEN has dropped by 189.51% within 24 hours during a significant market pullback
- OPEN's price plummeted 189.51% in 24 hours to $0.8907, marking its largest intraday decline in history. - The token fell 3793.63% over 7 days, matching identical monthly and yearly declines, signaling severe bearish momentum. - Technical analysts cite broken support levels and lack of bullish catalysts as key drivers of the sustained sell-off. - Absence of stabilizing volume or reversal patterns leaves the market vulnerable to further downward pressure.

New spot margin trading pair — LINEA/USDT!