
Bitcoin on Cusp of Rallying Higher as One Indicator Turns Bullish, Says Kevin Svenson – But There’s a Catch

Analyst and trader Kevin Svenson is leaning bullish on Bitcoin ( BTC ) as the flagship crypto asset continues to hover above the $100,000 price.
Svenson tells his 81,000 YouTube subscribers that based on the Moving Average Convergence/Divergence (MACD) indicator on the daily time frame, Bitcoin could surge higher over the short term.
According to the analyst, Bitcoin could go up by around six percent from the current price based on the Fibonacci extension levels – a tool used to determine potential price targets based on the Fibonacci sequence of numbers.
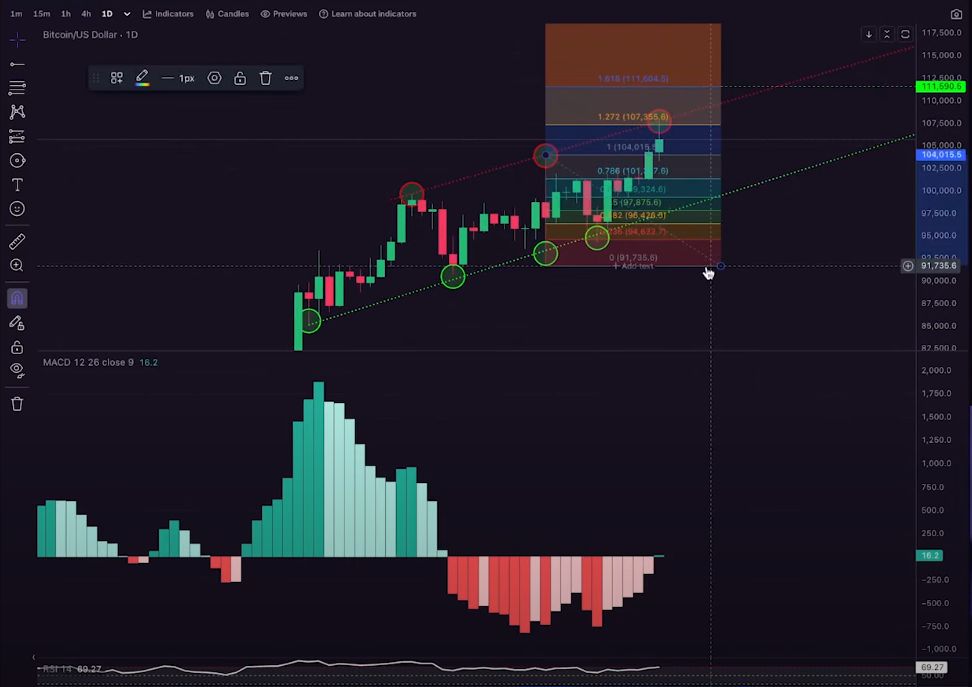
“I want to bring your attention to the daily MACD histograms. And what we can see is that we are attempting a cross-up – the bulls may be regaining momentum fully in the very near future…
… the bears have now lost their momentum and the bulls are regaining momentum. We are crossing up right now on the daily. So if we do get this cross-up and we close with a confirmed cross-up, I do think Bitcoin may be able to actually break this channel line, this resistance line and punch up towards the 1.618 Fibonacci [extension level]. $111,600 is the next major target.”
 Source: Kevin Svenson/YouTube
Svenson, however, says that Bitcoin “has a lot of room to move down” even amid a bullish trend.
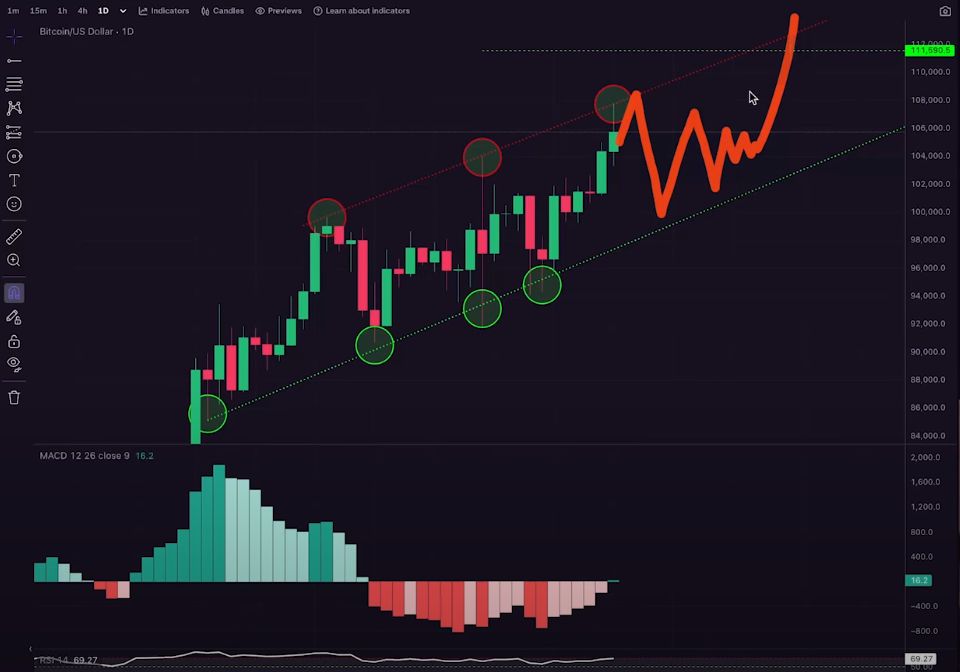
“If you’re looking at this upward-sloping channel, in theory, Bitcoin’s price could come all the way down to $100,000 and still be in an uptrend. You can imagine if Bitcoin’s price… let’s say chopped sideways for a bit and then dipped to $100,000, people would be freaking out as they always do.
But you just look at the uptrend line – that is a perfect buy zone for Bitcoin that is a great support target and that would be a higher low in the midst of a major bull market. I think the outcome would end up being pretty positive regardless if we saw a slight dip to retest the channel line, the upward-sloping channel line. I think Bitcoin would do just fine from there and continue the bull run.”
 Source: Kevin Svenson/YouTube
Bitcoin is trading at $105,135 at time of writing.
Don't Miss a Beat – Subscribe to get email alerts delivered directly to your inboxCheck Price Action
Follow us on X , Facebook and Telegram
Surf The Daily Hodl Mix
Generated Image: Midjourney
Disclaimer: The content of this article solely reflects the author's opinion and does not represent the platform in any capacity. This article is not intended to serve as a reference for making investment decisions.
You may also like
New spot margin trading pair — HOLO/USDT!
FUN drops by 32.34% within 24 hours as it faces a steep short-term downturn
- FUN plunged 32.34% in 24 hours to $0.008938, marking a 541.8% monthly loss amid prolonged bearish trends. - Technical breakdowns, elevated selling pressure, and forced liquidations highlight deteriorating market sentiment and risk-off behavior. - Analysts identify key support below $0.0080 as critical, with bearish momentum confirmed by RSI (<30) and MACD indicators. - A trend-following backtest strategy proposes short positions based on technical signals to capitalize on extended downward trajectories.

OPEN has dropped by 189.51% within 24 hours during a significant market pullback
- OPEN's price plummeted 189.51% in 24 hours to $0.8907, marking its largest intraday decline in history. - The token fell 3793.63% over 7 days, matching identical monthly and yearly declines, signaling severe bearish momentum. - Technical analysts cite broken support levels and lack of bullish catalysts as key drivers of the sustained sell-off. - Absence of stabilizing volume or reversal patterns leaves the market vulnerable to further downward pressure.

New spot margin trading pair — LINEA/USDT!