Bitget App
Trade smarter

BTC on-chain indicator hits bottom! LTH/STH ratio returns to bull market starting point
CryptoChan2024/12/21 05:47
By:CryptoChan
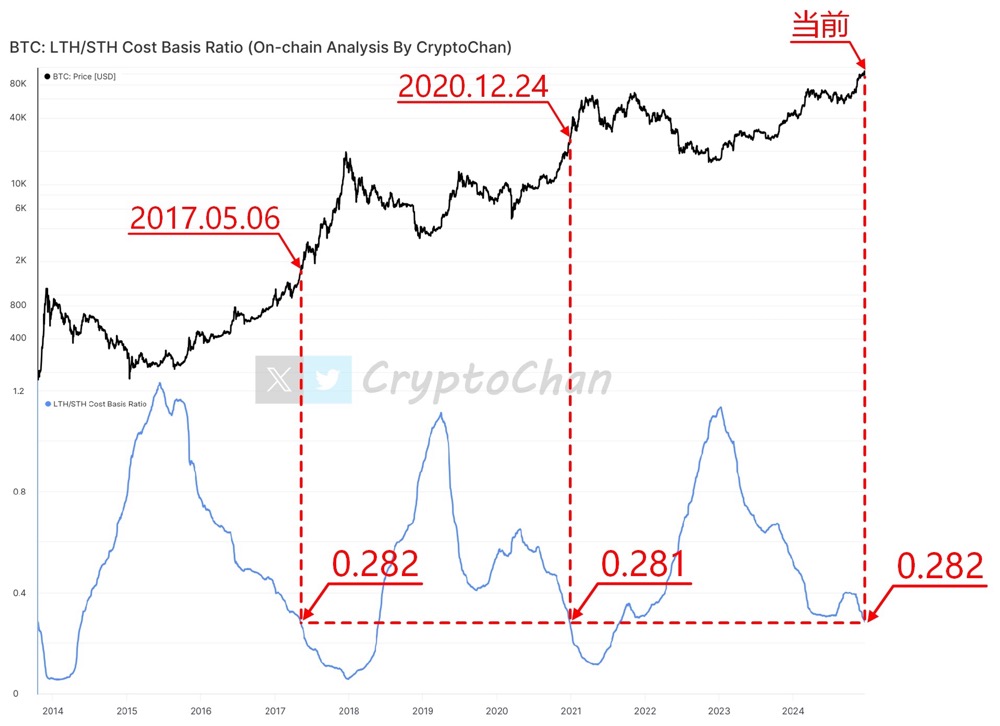
According to on-chain analyst CryptoChan, the ratio of the average price of
Bitcoin long-term holders (LTH) to short-term holders (STH) chips (LTH/STH cost benchmark ratio) has now dropped to
0.282 , which has been an important signal for the starting point of the bull market in history.
On May 6, 2017, after the indicator touched 0.282, the price of Bitcoin started around $1,500 and eventually reached a high of nearly $20,000 by the end of the year.
On December 24, 2020, the indicator fell to 0.281 again, and then Bitcoin ushered in a super bull market where the price broke through from $20,000 to $60,000;
Currently, the indicator has fallen back to 0.282 for the third time, and the trigger of this key area is highly similar to the starting point of the previous bull market.
The upper part of the chart shows the price trend of Bitcoin, and the shows the ratio indicator of "average buying price of long-term holders' chips" and "average buying price of short-term holders' chips". Current data indicates that the Bitcoin market is replicating the chip distribution status before the launch of the past two bull markets, which may imply an imminent price change.
8
19
Disclaimer: The content of this article solely reflects the author's opinion and does not represent the platform in any capacity. This article is not intended to serve as a reference for making investment decisions.
PoolX: Earn new token airdrops
Lock your assets and earn 10%+ APR
Lock now!
You may also like
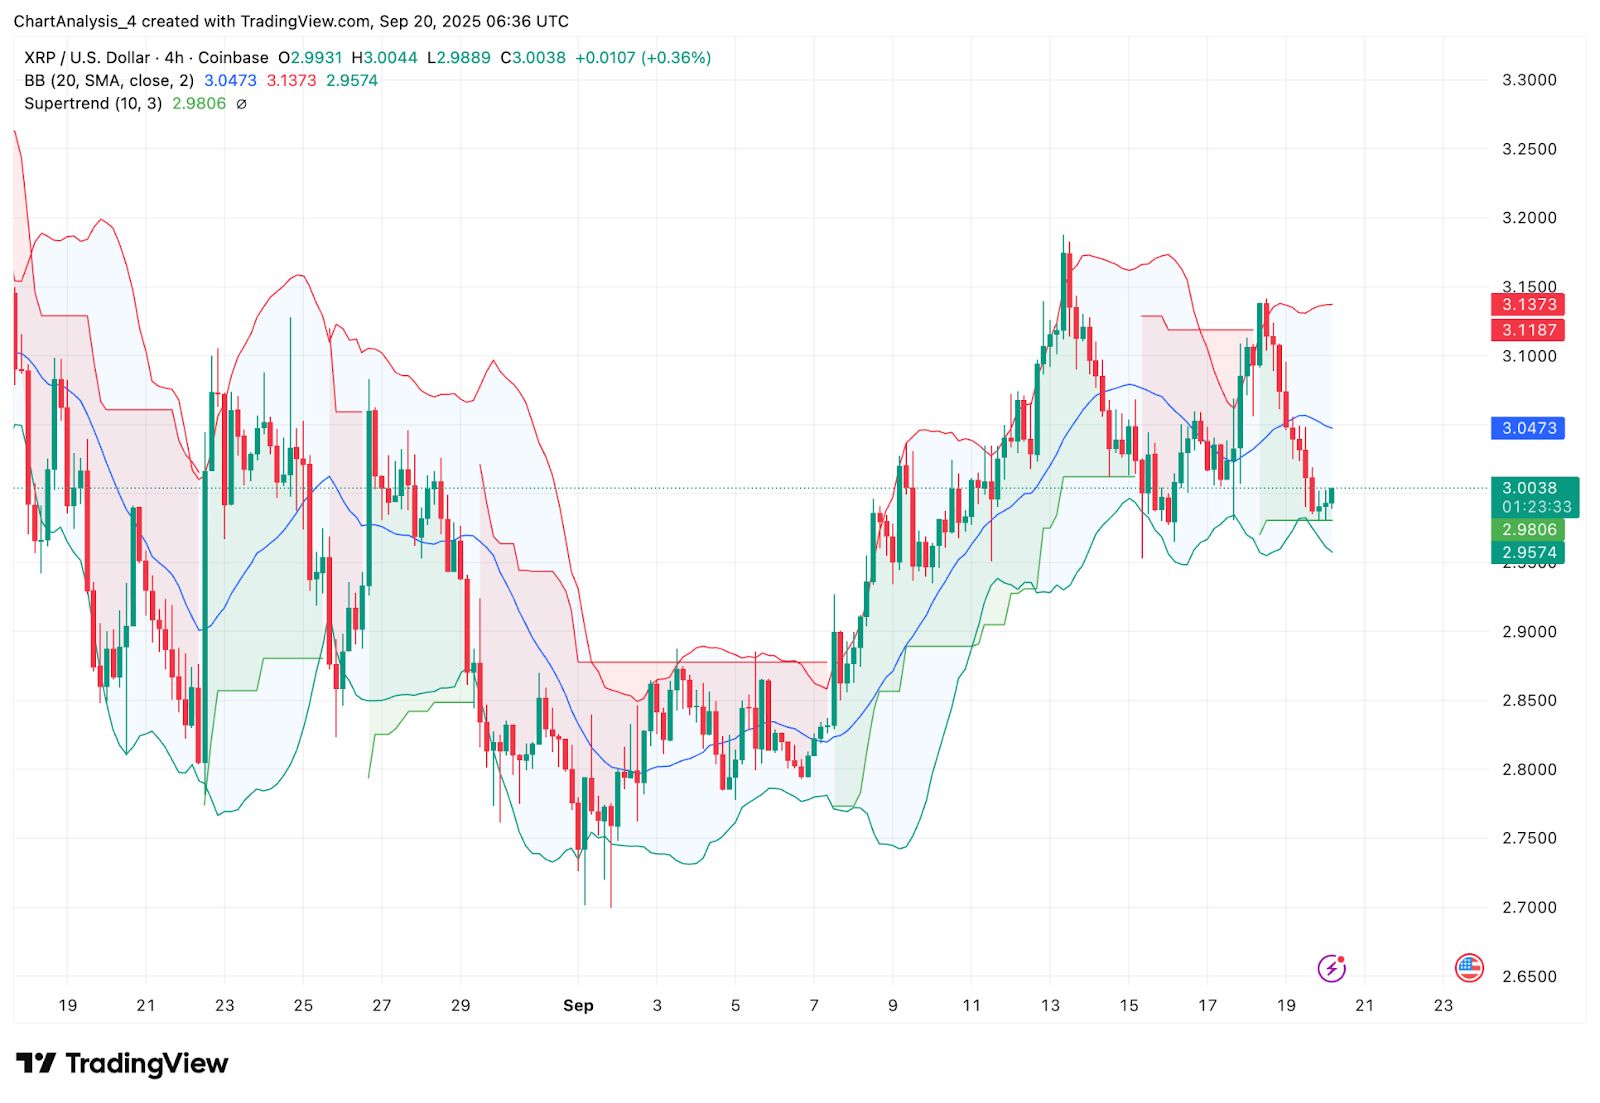
XRP Price Prediction: Analysts Watch $3.20 Breakout As Korean Custody News Fuels Speculation
CryptoNewsNet•2025/09/20 17:15
Michael Saylor: Bitcoin Is Building a Base as 'OG' Sellers Exit and Big Money Preps
CryptoNewsNet•2025/09/20 17:15
Big Move Ahead: SUI Gains 7% as Price Eyes Breakout Above $3.88
Cryptonewsland•2025/09/20 02:15

Altseason in Jeopardy: Altcoin OI Surpasses Bitcoin for 3rd Time—Top 5 Tokens Still Worth Holding
Cryptonewsland•2025/09/20 02:15

Trending news
MoreCrypto prices
MoreBitcoin
BTC
$115,711.45
+0.07%
Ethereum
ETH
$4,482.14
+0.37%
XRP
XRP
$2.98
-0.39%
Tether USDt
USDT
$1
-0.00%
BNB
BNB
$1,042.43
+6.31%
Solana
SOL
$239.35
+0.63%
USDC
USDC
$0.9998
-0.01%
Dogecoin
DOGE
$0.2672
+1.00%
TRON
TRX
$0.3468
+0.95%
Cardano
ADA
$0.8929
+0.46%
How to sell PI
Bitget lists PI – Buy or sell PI quickly on Bitget!
Trade now
Become a trader now?A welcome pack worth 6200 USDT for new users!
Sign up now