
Ethereum (ETH) Looks Set to Fall Below $3,000 Amid Whale Retreat

Ethereum's price is under threat of falling below $3,000 due to declining whale activity and bearish trading indicators. Discover the key price levels.
Ethereum (ETH) is currently facing downward pressure, with its price facing a potential decline below the $3,000 mark. Apart from the broader market consolidation, ETH’s current price fall is driven by the decrease in activity from its large investors.
This analysis explains why the price decline may occur and highlights the price points ETH holders should pay attention to.
Ethereum Faces Selloff Pressure as Whale Netflow Drops
According to IntoTheBlock, ETH’s large holders’ netflow has plummeted by 73.19% over the past seven days. Large holders are whale addresses that hold more than 0.1% of an asset’s circulating supply.
When an asset witnesses a fall in whales’ netflow, it indicates that its big investors are reducing their positions by selling off or transferring assets. This often signals a lack of confidence in the asset’s short-term prospects, leading to potential downward price pressure as these holders move their funds elsewhere.
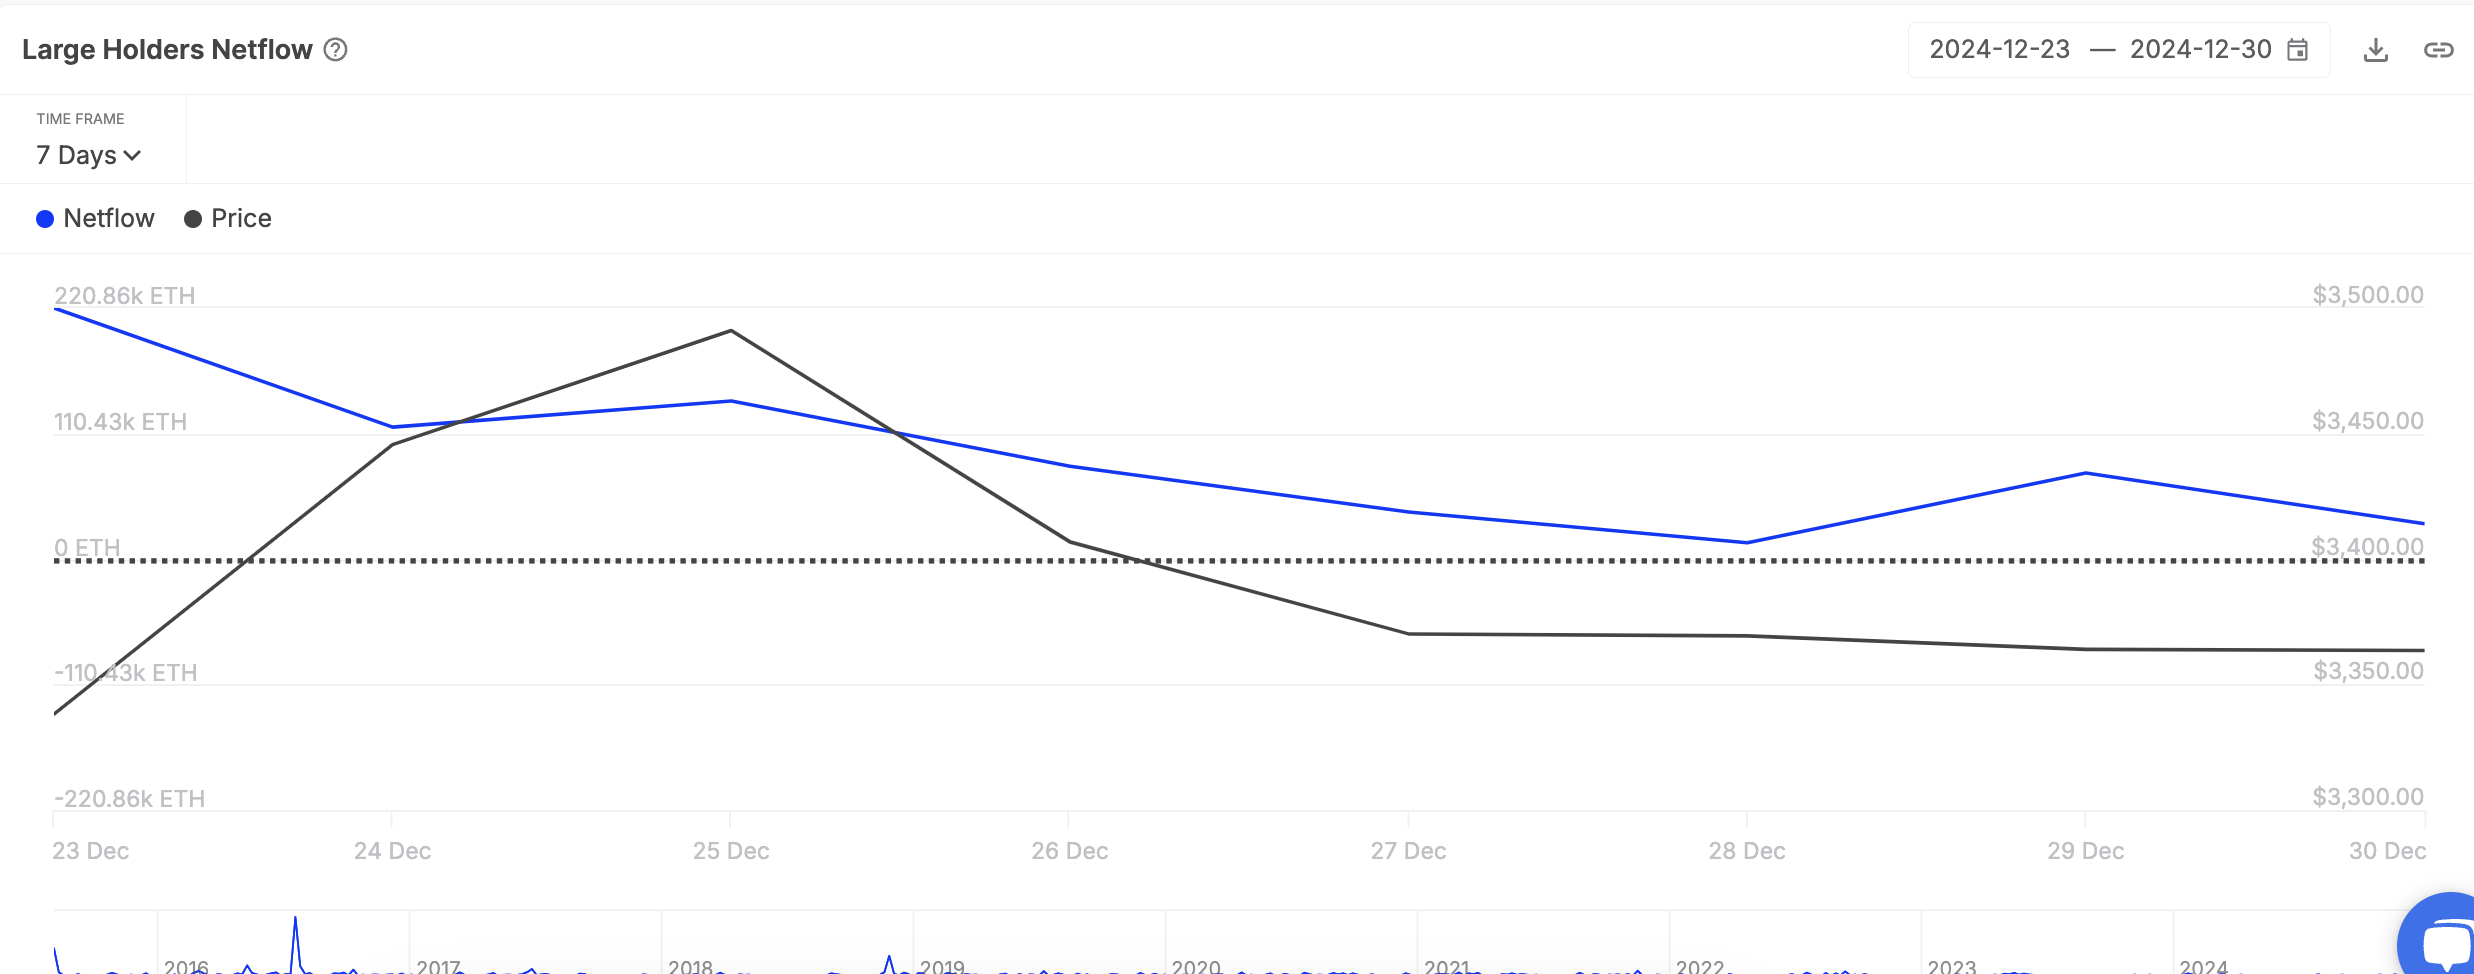 Ethereum Large Holders Netflow. Source:
IntoTheBlock
Ethereum Large Holders Netflow. Source:
IntoTheBlock
In addition to reduced whale accumulation, ETH’s Taker-Buy-Sell ratio has been predominantly less than one in the past seven days, indicating selloffs among its derivatives traders. According to CryptoQuant, this stands at 0.94 at press time.
An asset’s Taker-Buy-Sell ratio measures the proportion of buy orders to sell orders executed by market takers. A ratio below one indicates that sell orders outweigh buy orders, signaling bearish sentiment. This suggests selling pressure exceeds buying interest, often hinting at potential price declines as more traders exit positions than enter them.
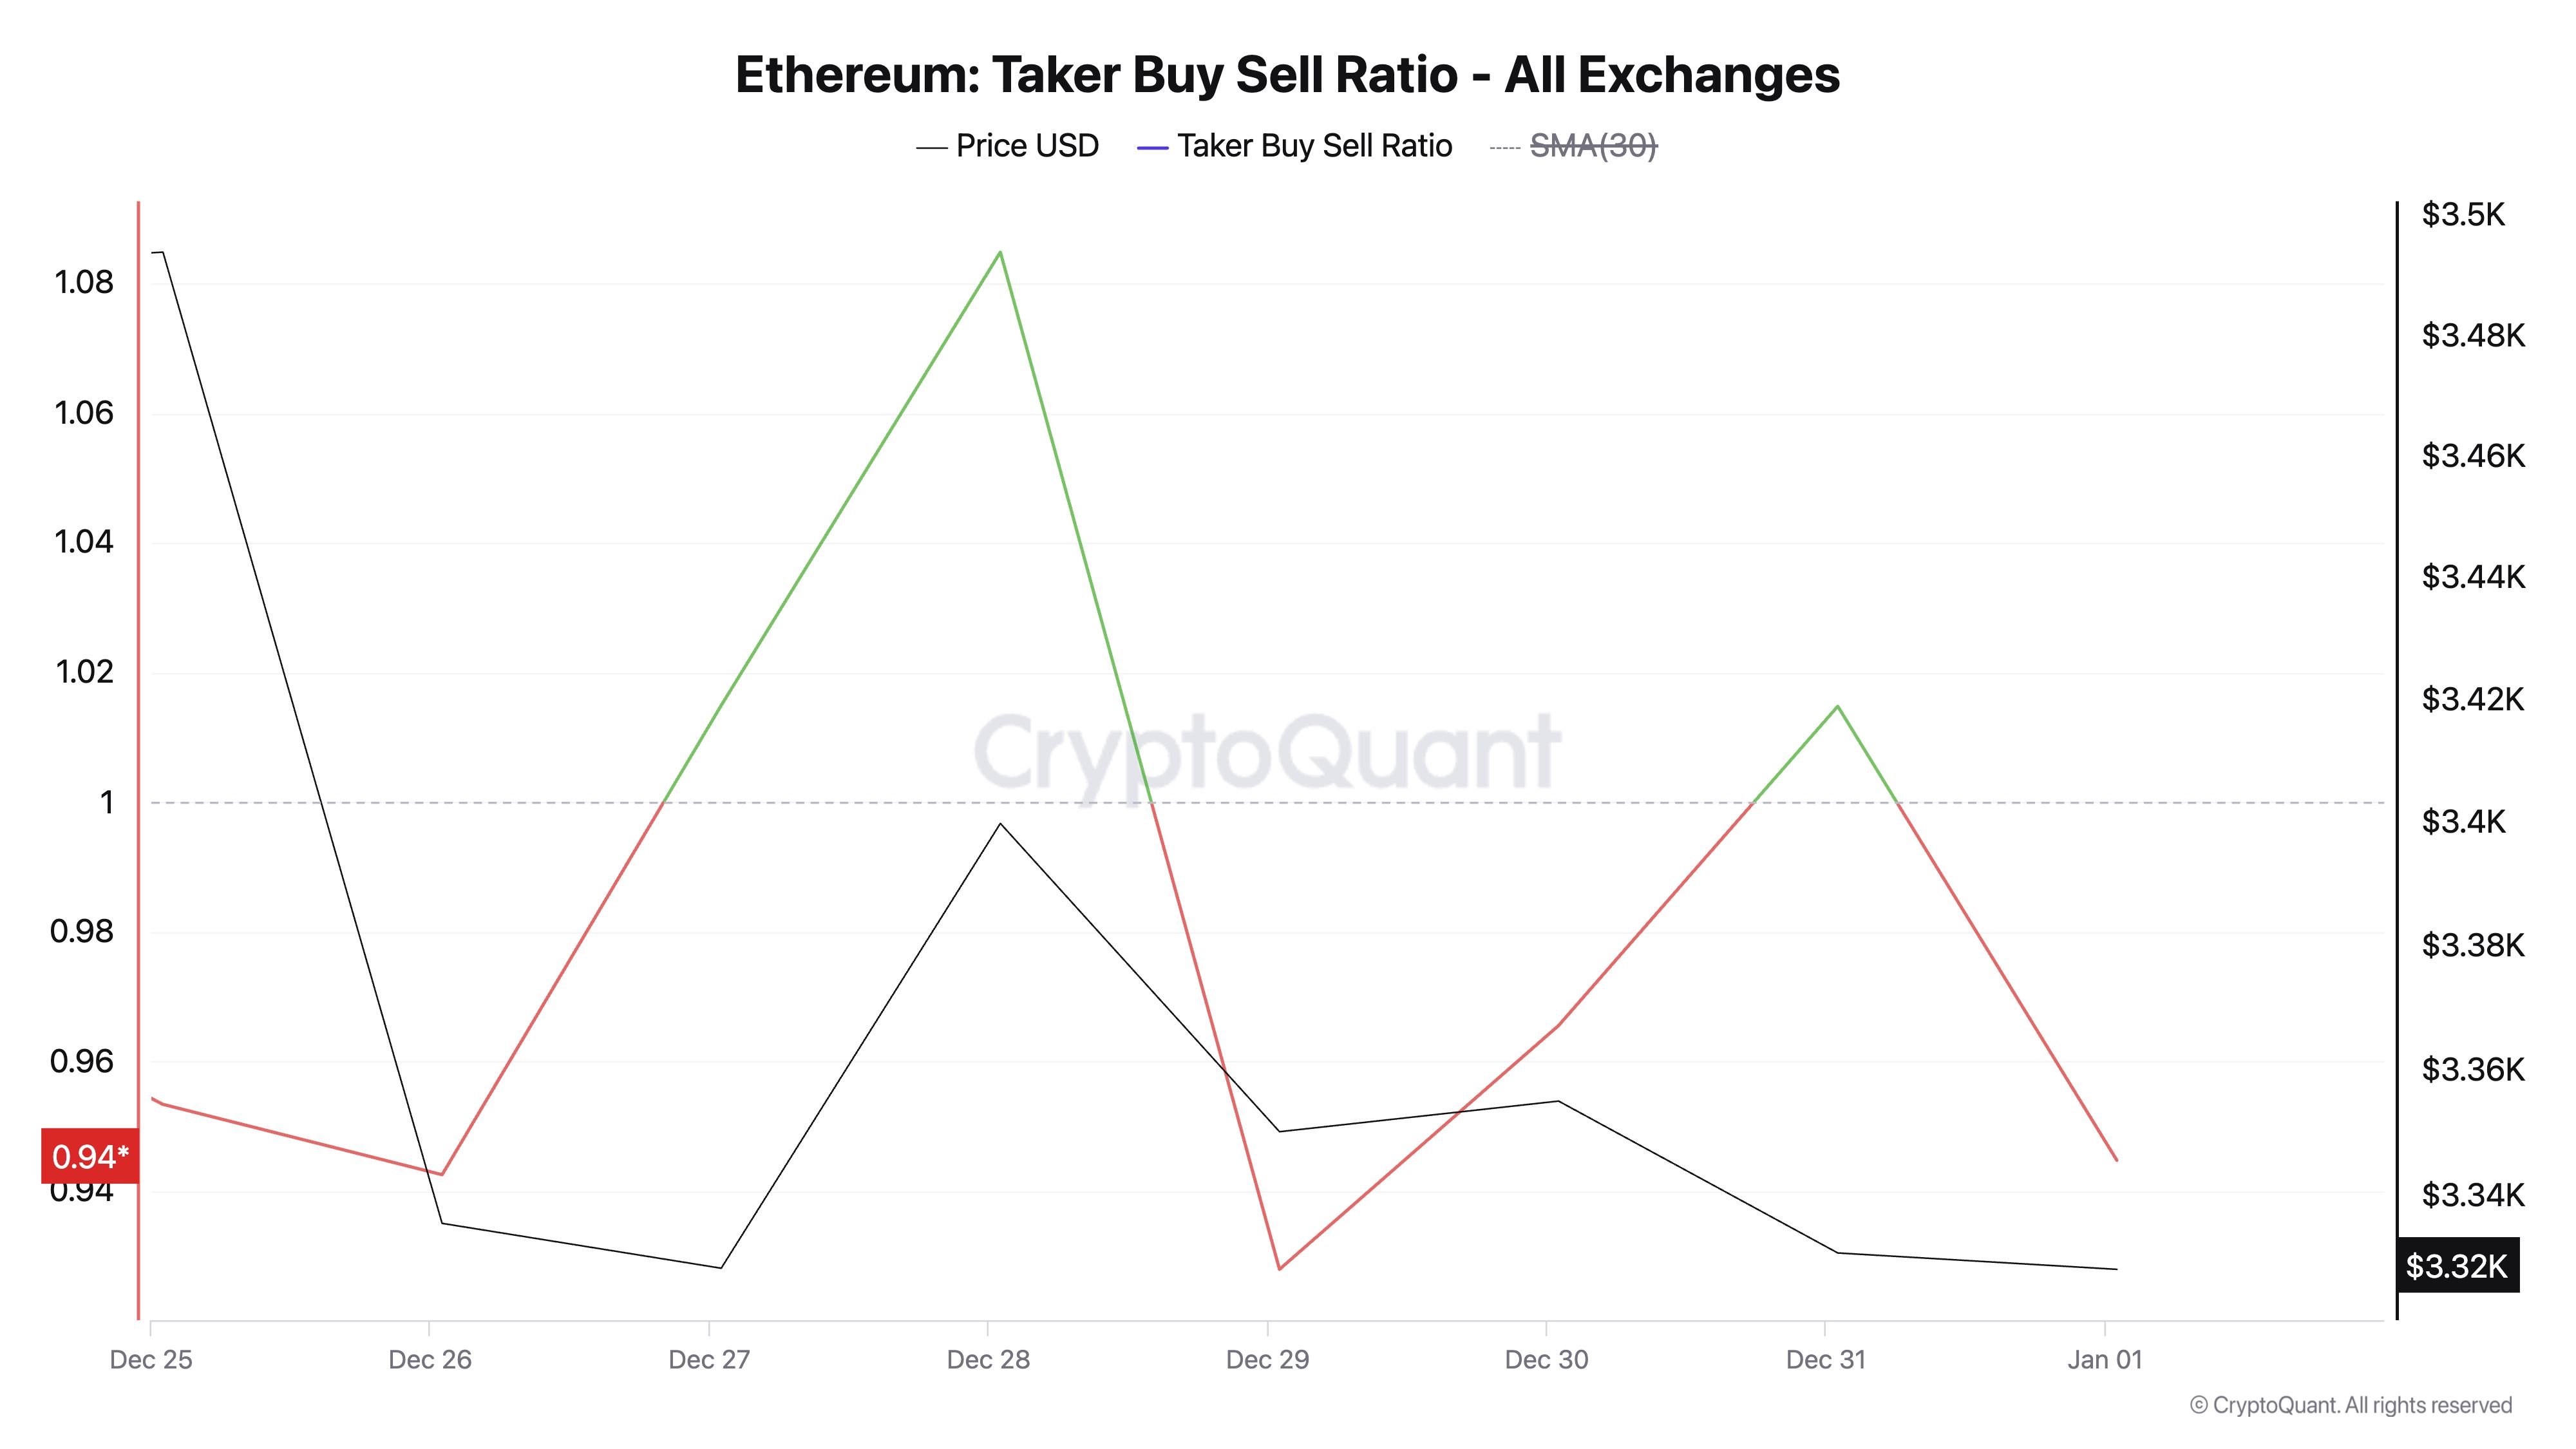 Ethereum Taker Buy Sell Ratio. Source:
CryptoQuant
Ethereum Taker Buy Sell Ratio. Source:
CryptoQuant
ETH Price Prediction: All Lies With the Whales
On the daily chart, readings from ETH’s Moving Average Convergence Divergence confirm the drop in the demand for the leading altcoin. At press time, the coin’s MACD line (blue) rests below its signal line (orange) and zero line.
This indicator helps traders identify changes in a trend’s strength, direction, and duration. As with ETH, when the MACD line is below the signal line, it indicates a bearish trend. If selling pressure strengthens further, ETH’s price could fall below support at $3,070 to trade at $2,558.
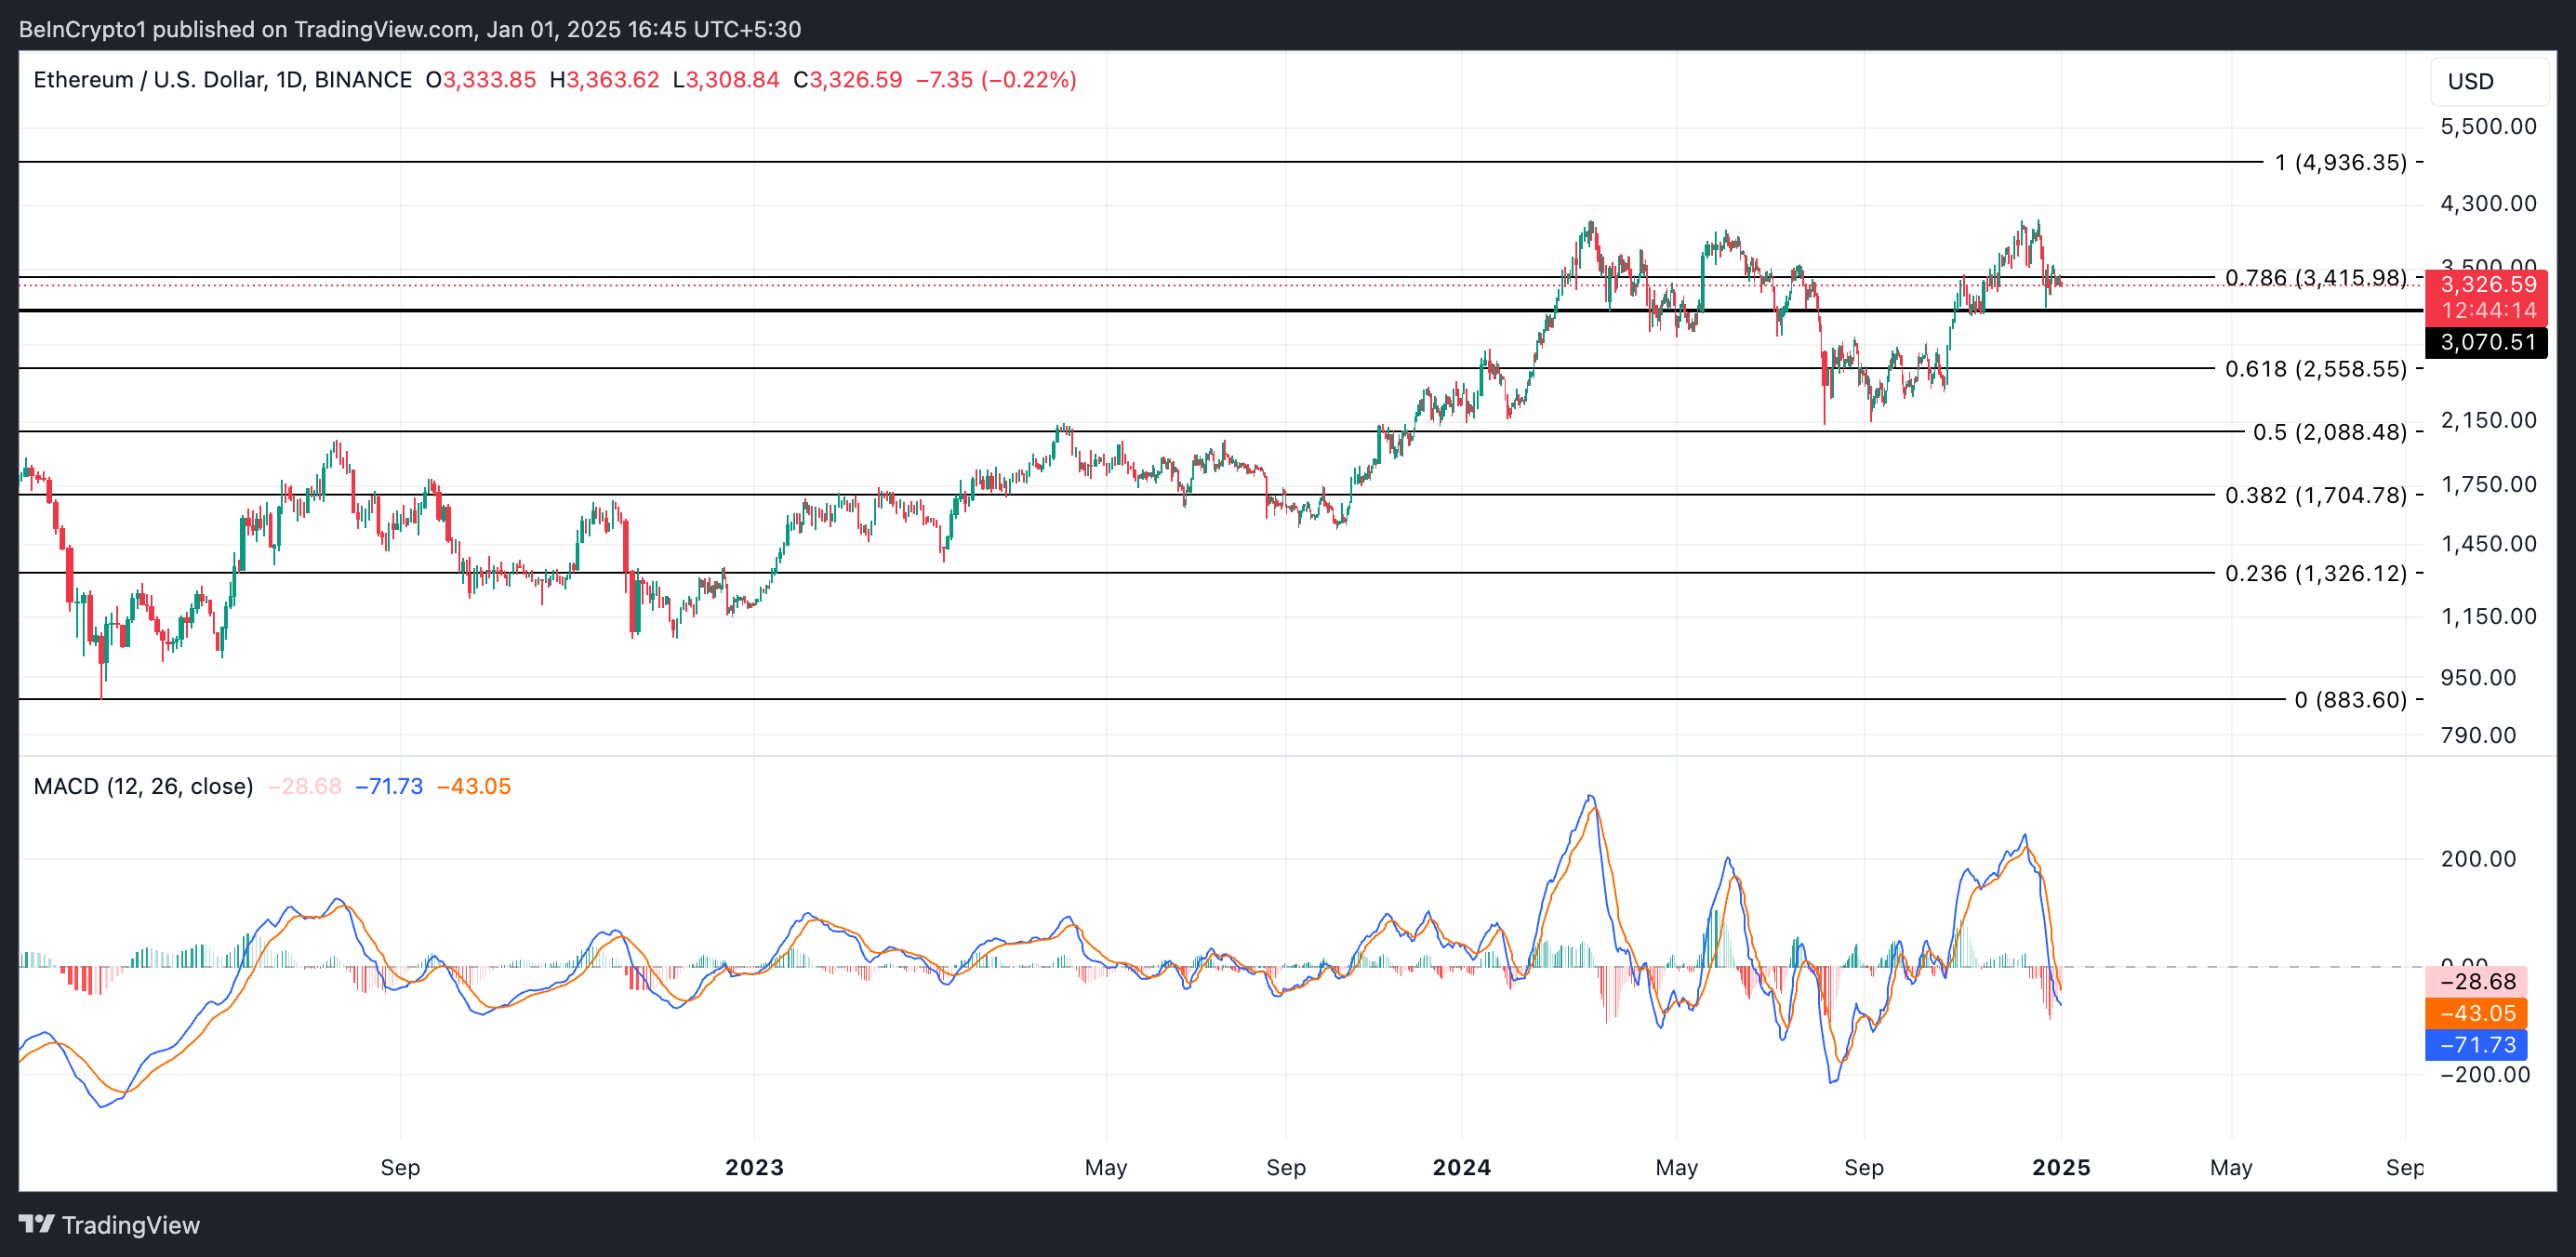 Ethereum Price Analysis. Source:
TradingView
Ethereum Price Analysis. Source:
TradingView
On the other hand, if market sentiment improves and ETH whales resume accumulation, they may drive the coin’s price toward $3,415.
Disclaimer: The content of this article solely reflects the author's opinion and does not represent the platform in any capacity. This article is not intended to serve as a reference for making investment decisions.
You may also like
New spot margin trading pair — HOLO/USDT!
FUN drops by 32.34% within 24 hours as it faces a steep short-term downturn
- FUN plunged 32.34% in 24 hours to $0.008938, marking a 541.8% monthly loss amid prolonged bearish trends. - Technical breakdowns, elevated selling pressure, and forced liquidations highlight deteriorating market sentiment and risk-off behavior. - Analysts identify key support below $0.0080 as critical, with bearish momentum confirmed by RSI (<30) and MACD indicators. - A trend-following backtest strategy proposes short positions based on technical signals to capitalize on extended downward trajectories.

OPEN has dropped by 189.51% within 24 hours during a significant market pullback
- OPEN's price plummeted 189.51% in 24 hours to $0.8907, marking its largest intraday decline in history. - The token fell 3793.63% over 7 days, matching identical monthly and yearly declines, signaling severe bearish momentum. - Technical analysts cite broken support levels and lack of bullish catalysts as key drivers of the sustained sell-off. - Absence of stabilizing volume or reversal patterns leaves the market vulnerable to further downward pressure.

New spot margin trading pair — LINEA/USDT!