- VIRTUAL’s price decline signals a potential bounce at key support levels near $3.85.
- Strong resistance at $4.40 suggests selling pressure; monitor for reversal signals.
- RSI indicates room for upside, but MACD hints at slowing bullish momentum.
Virtuals Protocol’s VIRTUAL token has attracted attention due to its volatility. Market analyst Michaël van de Poppe recently discussed the price action of AI agent tokens, in particular VIRTUAL.
Van de Poppe says VIRTUAL shows significant volatility, similar to XRP’s past price action. He suggests that identifying high-time-frame (HTF) support areas could reveal opportunities for bounce plays. He points to the $2.50–$3.00 range as a key zone.
VIRTUAL Price Movement and Market Activity
As of press time, VIRTUAL is trading at $3.86 , reflecting a 6.77% drop in the last 24 hours. The token saw an impressive upward movement recently, reaching a high of $4.40 before experiencing a sharp decline.
This downtrend continued as prices fell below $4.00, with the token stabilizing around $3.86. This pullback indicates profit-taking. 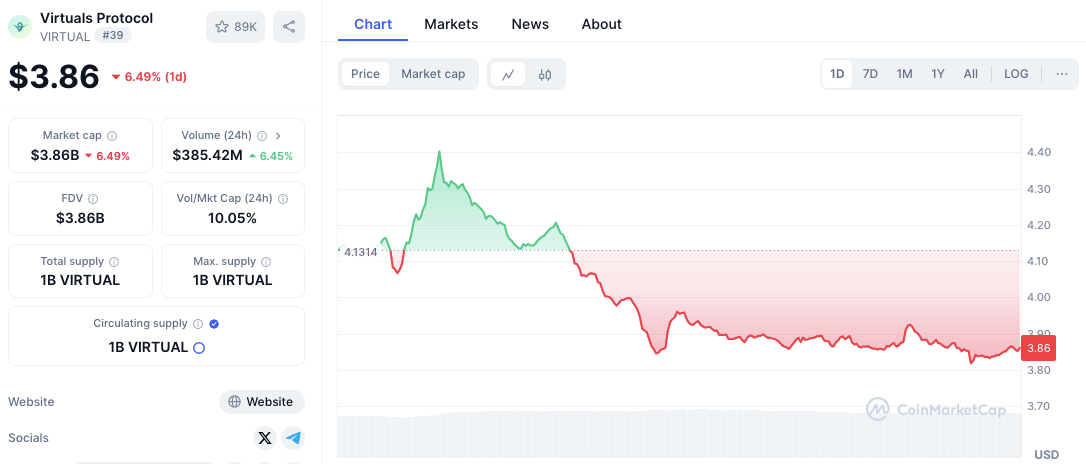
Source: Coinmarketcap
The token’s 24-hour trading volume is $386.68 million, up 7.24%. This suggests heightened market activity despite the price decline. The market cap of $3.85 billion shows the token’s size in the crypto market.
Support and Resistance Levels to Monitor
In terms of technical levels, the resistance zone is firmly established around $4.40. This price point was rejected sharply, signaling strong selling pressure. Another potential resistance zone lies between $4.10 and $4.20, where consolidation occurred during the initial price drop.
On the support side, $3.85 is a critical level to watch. The token has shown signs of stabilization near this price, but if it fails to hold, a further downside could be in store. A potential support range is observed between $3.70 and $3.75, where buyers might re-enter the market.
Technical Indicators Suggest Caution
 VIRTUAL/USD daily price chart, Source: Trading view
Analyzing key technical indicators provides further insights into the token’s potential movements. The Relative Strength Index (RSI) is currently at 59.36, suggesting strong buying interest, though it remains below the overbought threshold of 70. This implies that there is room for further upside before the market becomes overbought.
The Moving Average Convergence Divergence (MACD) presents a mixed outlook. The MACD line remains above the signal line, signaling bullish momentum. However, the histogram shows decreasing momentum.
Disclaimer: The information presented in this article is for informational and educational purposes only. The article does not constitute financial advice or advice of any kind. Coin Edition is not responsible for any losses incurred as a result of the utilization of content, products, or services mentioned. Readers are advised to exercise caution before taking any action related to the company.