
Understanding the Banana Zone Through XRP and XLM

Raoul Pal’s “Banana Zone” theory offers a strategic lens to understand cryptocurrency price movements and market phases. XRP and XLM serve as prime examples of how altcoins navigate these phases, showcasing market rivalry and dynamics. This article explores the implications of the Banana Zone, XRP’s market performance , and its competition with XLM as they vie for dominance in blockchain payments.
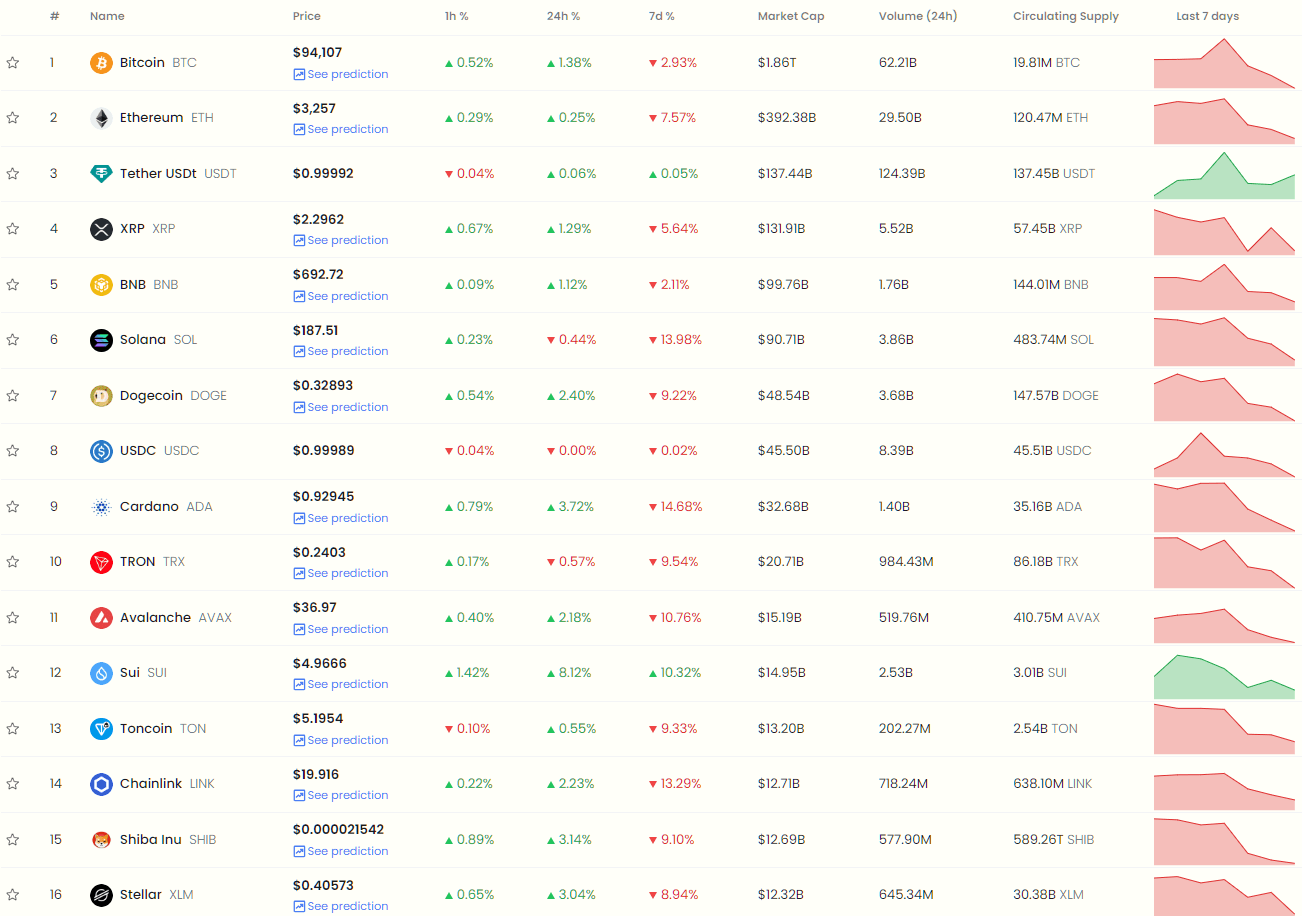 By CryptoTicker - All Cryptocurrencies Performance
1- The Banana Zone and Its Implications for Altcoins
The “Banana Zone,” coined by crypto expert Raoul Pal , outlines a roadmap for cryptocurrency price cycles, offering investors a guide to market behavior. This concept is particularly relevant to altcoins, which often exhibit dramatic price movements in these phases:
Phase 1: Breakout and Consolidation
The initial breakout phase, marked by rapid price surges, transitions into a consolidation period. XRP exemplifies this phase, maintaining stability above $2.20 despite recent market fluctuations. Pal compares this stage to the crypto market’s behavior in 2016-2017, suggesting a period of accumulation before the next big move.
Phase 2: Altcoin Season (Banana Singularity)
In this phase, altcoins experience widespread upward movement. XLM’s recent 20% surge in early January highlights this dynamic. However, the subsequent correction, wiping out half of the gains, underscores the volatility characteristic of altcoin seasons.
Phase 3: Concentration Phase
This final phase sees core market winners, such as XRP, reaching new highs. XRP’s resilience, even amidst broader market consolidation, positions it as a leading contender at this stage.
The Banana Zone framework not only helps explain the current state of the market but also sets expectations for altcoins like XRP and XLM, which are navigating these cycles with distinct strategies.
2- XRP vs. XLM: A Rivalry in the Banana Zone
The competition between XRP and XLM exemplifies the dynamics of the Banana Zone, with both tokens aiming to capitalize on their unique strengths in blockchain payments:
XRP’s Institutional Edge: Designed for large-scale financial institutions, XRP has carved out a niche in cross-border payments. Its ability to maintain price levels and outperform XLM highlights its strength as a market leader.
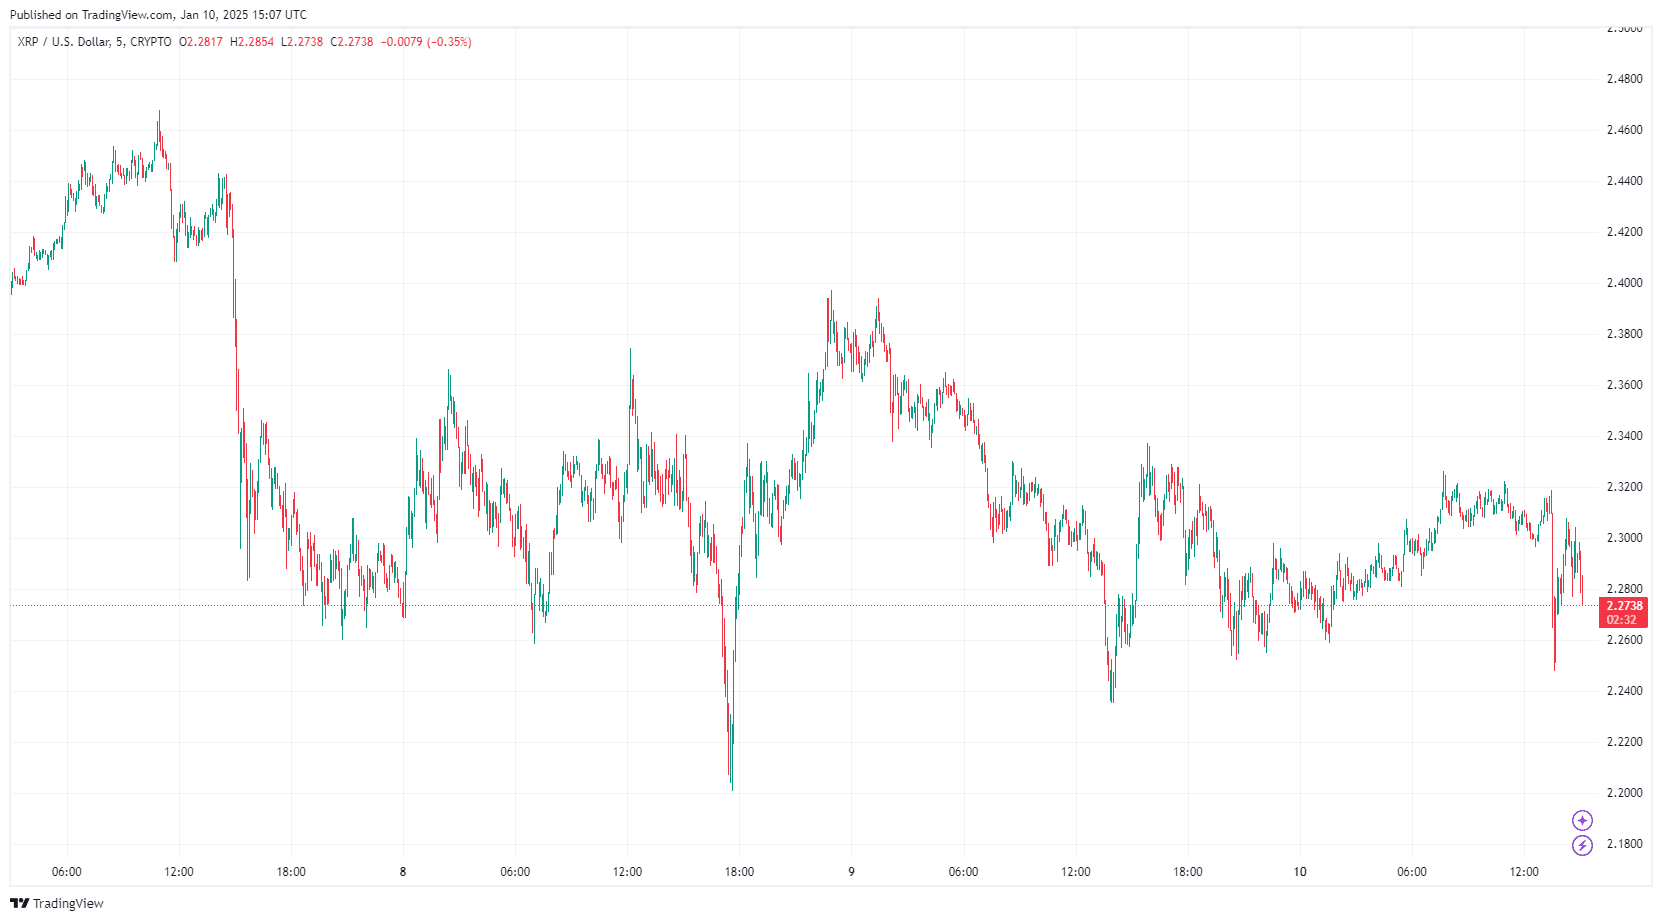 By TradingView - XRPUSD_2025-01-10 (5D)
XLM’s Individual Focus: While XRP targets banks and corporations, XLM focuses on providing financial solutions for individuals. This difference in strategy has fueled their rivalry, with each token striving to outperform the other.
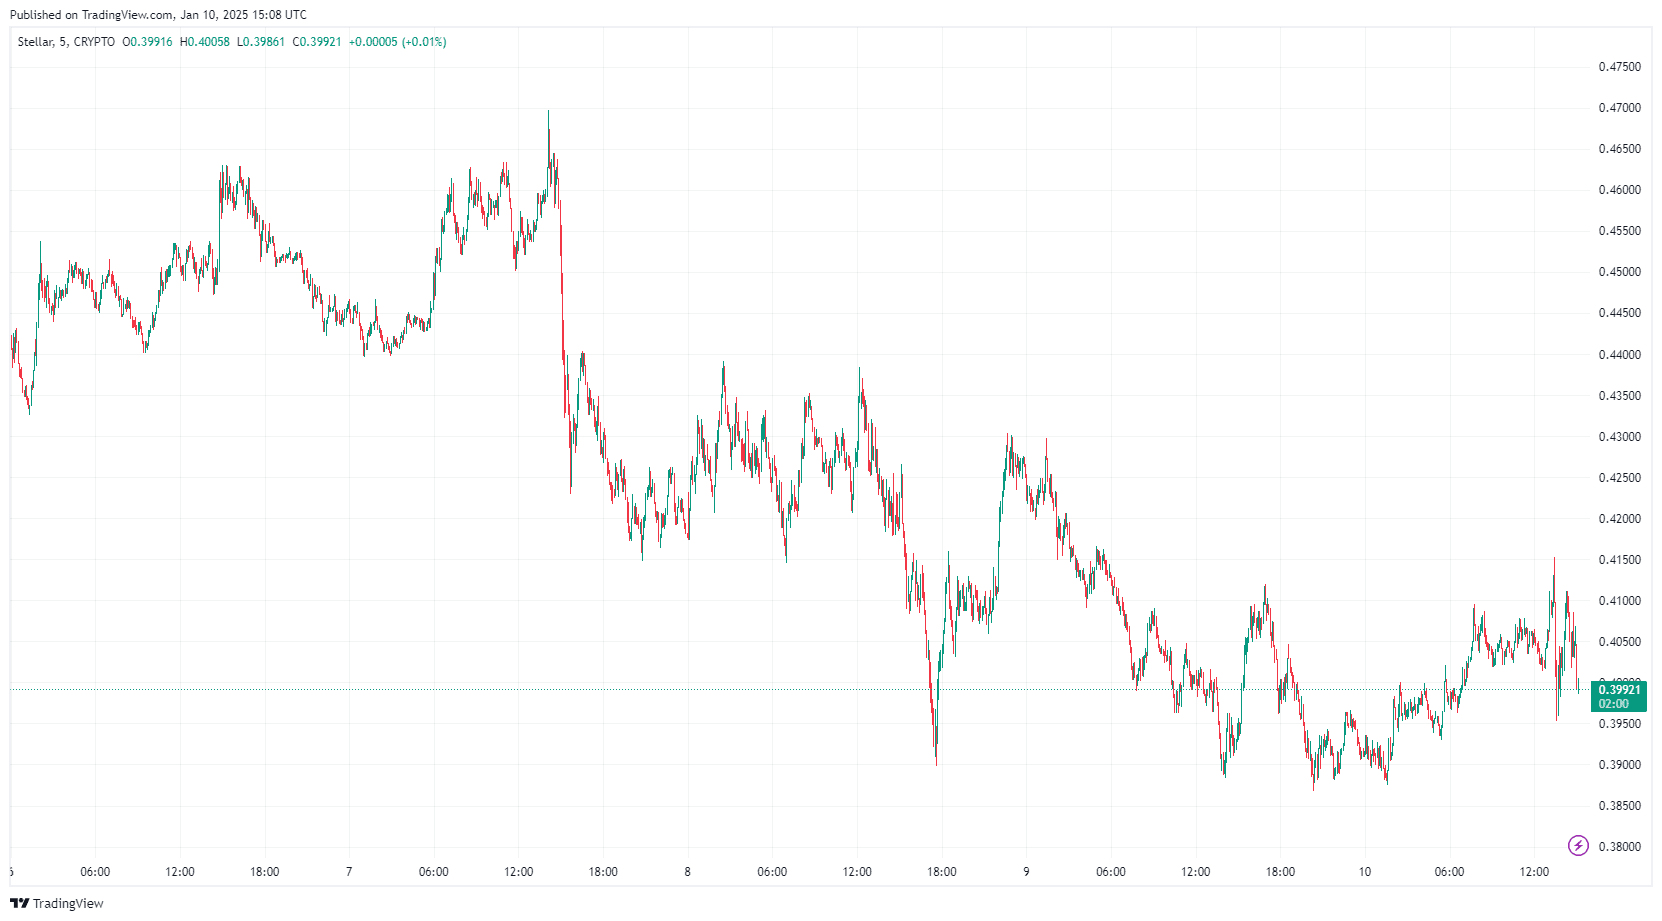 By TradingView - XLMUSD_2025-01-10 (5D)
Recent performance data reflects this competition:
- XLM surged 20% in early January, demonstrating its potential during the Banana Zone’s altcoin season. However, its failure to hold above the 200-day moving average against XRP resulted in a 10% drop, now valuing 1 XLM at 0.17 XRP.
- XRP, meanwhile, continues to consolidate and hold ground above $2.20, reflecting a strong foundation even under market pressure.
The rivalry between XRP and XLM showcases how altcoins can leverage the Banana Zone phases, with XRP emerging as a frontrunner due to its institutional backing and market resilience.
3- What’s Next for XRP?
As XRP approaches a critical SEC appeal in five days, its price dynamics are poised for potential volatility. Key technical levels to watch include:
- Resistance Levels: $2.320 and $2.350, with a breakout potentially pushing XRP toward $2.40 and $2.50.
- Support Levels: Immediate support at $2.250 and stronger support at $2.220. A breach below these levels could lead to a deeper correction.
Indicators such as the RSI remaining above 50 and a steady MACD signal suggest a possible bullish breakout. However, the outcome of the SEC appeal will be pivotal in shaping XRP’s trajectory .
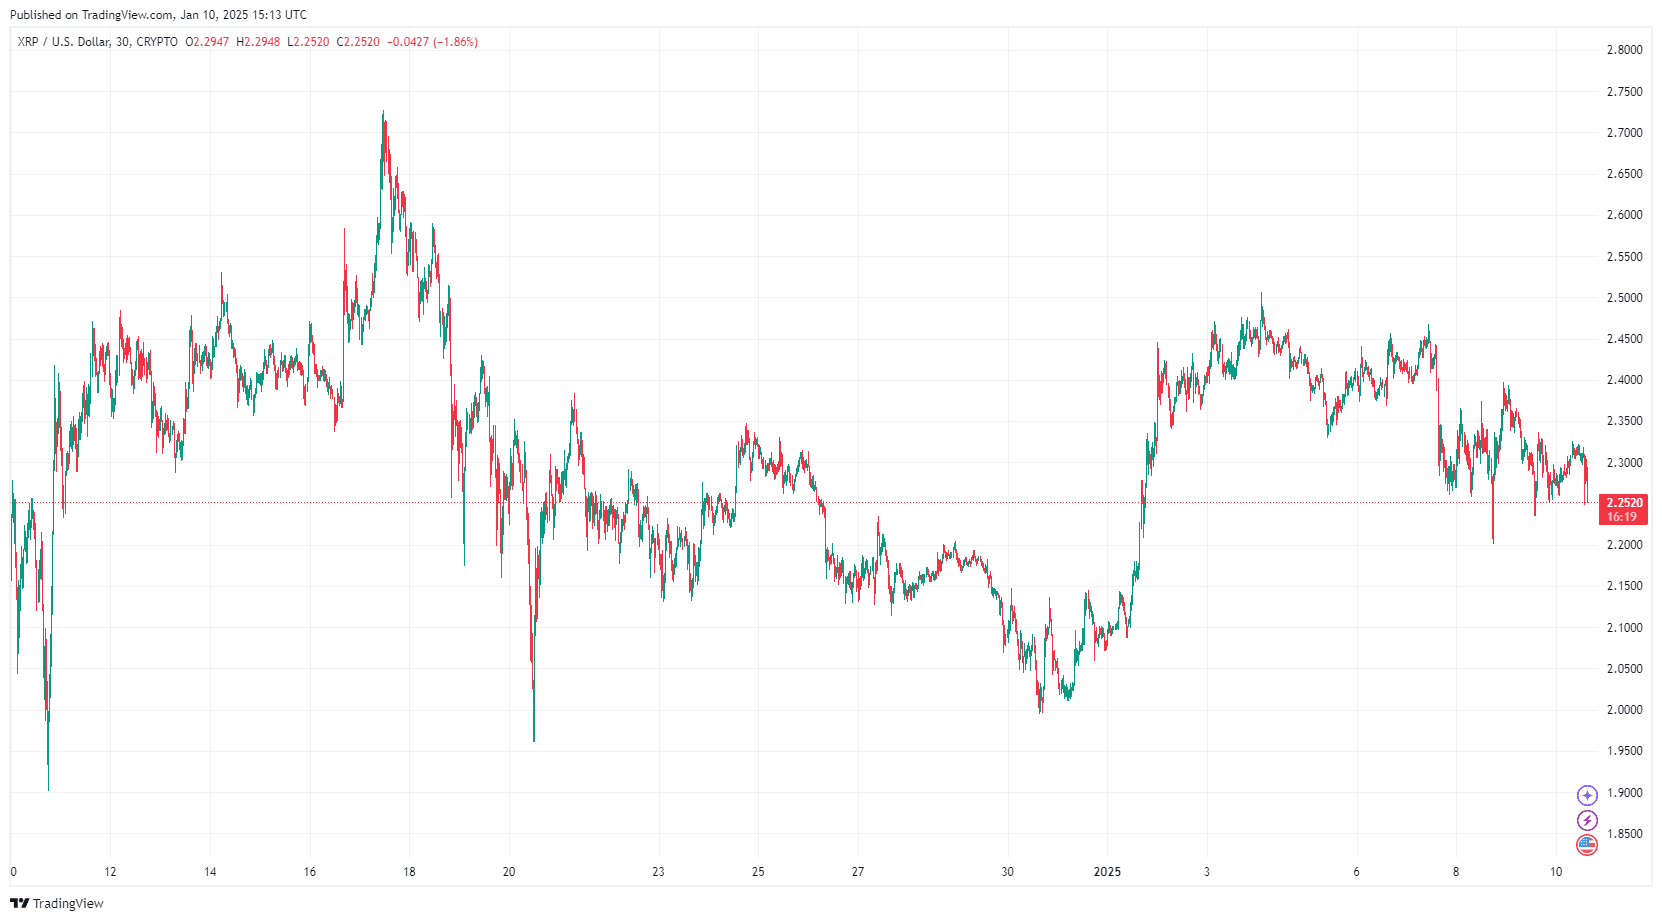 By TradingView - XRPUSD_2025-01-10 (1M)
Disclaimer: The content of this article solely reflects the author's opinion and does not represent the platform in any capacity. This article is not intended to serve as a reference for making investment decisions.
You may also like
New spot margin trading pair — HOLO/USDT!
FUN drops by 32.34% within 24 hours as it faces a steep short-term downturn
- FUN plunged 32.34% in 24 hours to $0.008938, marking a 541.8% monthly loss amid prolonged bearish trends. - Technical breakdowns, elevated selling pressure, and forced liquidations highlight deteriorating market sentiment and risk-off behavior. - Analysts identify key support below $0.0080 as critical, with bearish momentum confirmed by RSI (<30) and MACD indicators. - A trend-following backtest strategy proposes short positions based on technical signals to capitalize on extended downward trajectories.

OPEN has dropped by 189.51% within 24 hours during a significant market pullback
- OPEN's price plummeted 189.51% in 24 hours to $0.8907, marking its largest intraday decline in history. - The token fell 3793.63% over 7 days, matching identical monthly and yearly declines, signaling severe bearish momentum. - Technical analysts cite broken support levels and lack of bullish catalysts as key drivers of the sustained sell-off. - Absence of stabilizing volume or reversal patterns leaves the market vulnerable to further downward pressure.

New spot margin trading pair — LINEA/USDT!