Bitget App
Trade smarter

Bitcoin aims at big bull: comparison chart of 2016 and 2024 halving reveals future trend
CryptoChan2025/01/17 02:08
By:CryptoChan
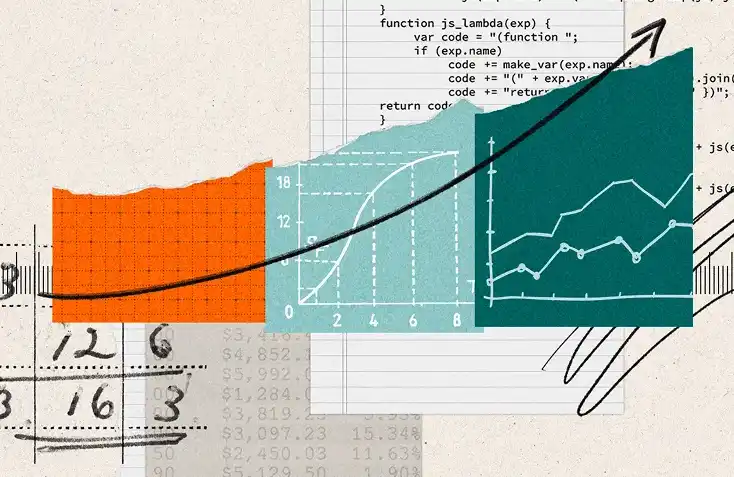
By comparing the impact of the Bitcoin halving event in 2016 and 2024, the future trend can be inferred. From the chart, it can be seen that after the halving on July 9, 2016, the Bitcoin price continued to rise and showed a strong growth trend in the next 254 days. At the halving on April 20, 2024, the BTC price is almost completely aligned with the trend in 2016. By aligning the bear market bottom in 2015 with the bear market bottom in 2022, the chart highlights the price changes before and after the two halvings.
From the chart, it can be seen that the price trend before the halving on April 20, 2024 (black line) is similar to the trend before and after the halving on July 9, 2016 (red line), both showing significant bull market prospects. This also provides an important reference for the market - the Bitcoin price may move towards higher value in the months after the halving.
With the approach of the 2024 halving, the market's expectations for the price of Bitcoin have once again heated up. Especially against the backdrop of the 2024 halving, the price performance of BTC may follow a similar upward path as in 2016, indicating a potential bull market in the coming months.
Data Highlights:
-2016 Halving (Red Line): The rise in BTC price began 254 days after the halving, showing a strong market rebound.
Halving in 2024 (black line): The current trend is consistent with 2016. If the historical pattern continues, it may usher in a bull market.
Market participants and investors should closely monitor the upcoming halving event and prepare for possible market changes.

1
0
Disclaimer: The content of this article solely reflects the author's opinion and does not represent the platform in any capacity. This article is not intended to serve as a reference for making investment decisions.
PoolX: Earn new token airdrops
Lock your assets and earn 10%+ APR
Lock now!
You may also like
Will PayFi be the next narrative for RWA?
Can uncollateralized credit lending protocols work in the DeFi world?
雨中狂睡•2025/09/13 18:03

Why are the new DAT setups by Multicoin, Jump, and Galaxy underestimated?
ChainFeeds•2025/09/13 18:02
a16z's Latest Insight: Consumer AI Companies Will Redefine the Enterprise Software Market
The boundaries between the consumer market and the enterprise market are gradually becoming blurred to some extent.
BlockBeats•2025/09/13 17:54
Bitcoin all-time highs due in ‘2-3 weeks’ as price fills $117K futures gap
Cointelegraph•2025/09/13 17:51
Trending news
MoreCrypto prices
MoreBitcoin
BTC
$115,603.05
-0.49%
Ethereum
ETH
$4,644.59
+0.53%
XRP
XRP
$3.11
+1.42%
Tether USDt
USDT
$1
-0.01%
BNB
BNB
$928.82
+0.92%
Solana
SOL
$238.24
-1.19%
USDC
USDC
$0.9998
-0.02%
Dogecoin
DOGE
$0.2857
+5.35%
TRON
TRX
$0.3490
-0.27%
Cardano
ADA
$0.9226
+1.87%
How to sell PI
Bitget lists PI – Buy or sell PI quickly on Bitget!
Trade now
Become a trader now?A welcome pack worth 6200 USDT for new users!
Sign up now