
Can Cardano (ADA) Rebound to New Highs or Is a Deeper Drop Coming?

Cardano (ADA) has recently seen a strong correction after reaching highs above $1.20, now trading near the $0.70 support zone. Investors and traders are now questioning whether this dip presents a buying opportunity or if further downside is ahead. With market volatility increasing, ADA’s price structure suggests a critical juncture that could define its trajectory for the next few months.
The latest price action on the daily chart indicates that ADA has broken below key resistance-turned-support zones, leading to bearish sentiment. However, the RSI is hovering near oversold territory, raising the possibility of a rebound. In this analysis, we will examine ADA’s technical levels, momentum indicators, and market sentiment to assess whether Cardano is poised for a strong comeback or further decline.
Is ADA at Risk of Further Decline or Nearing a Bottom?
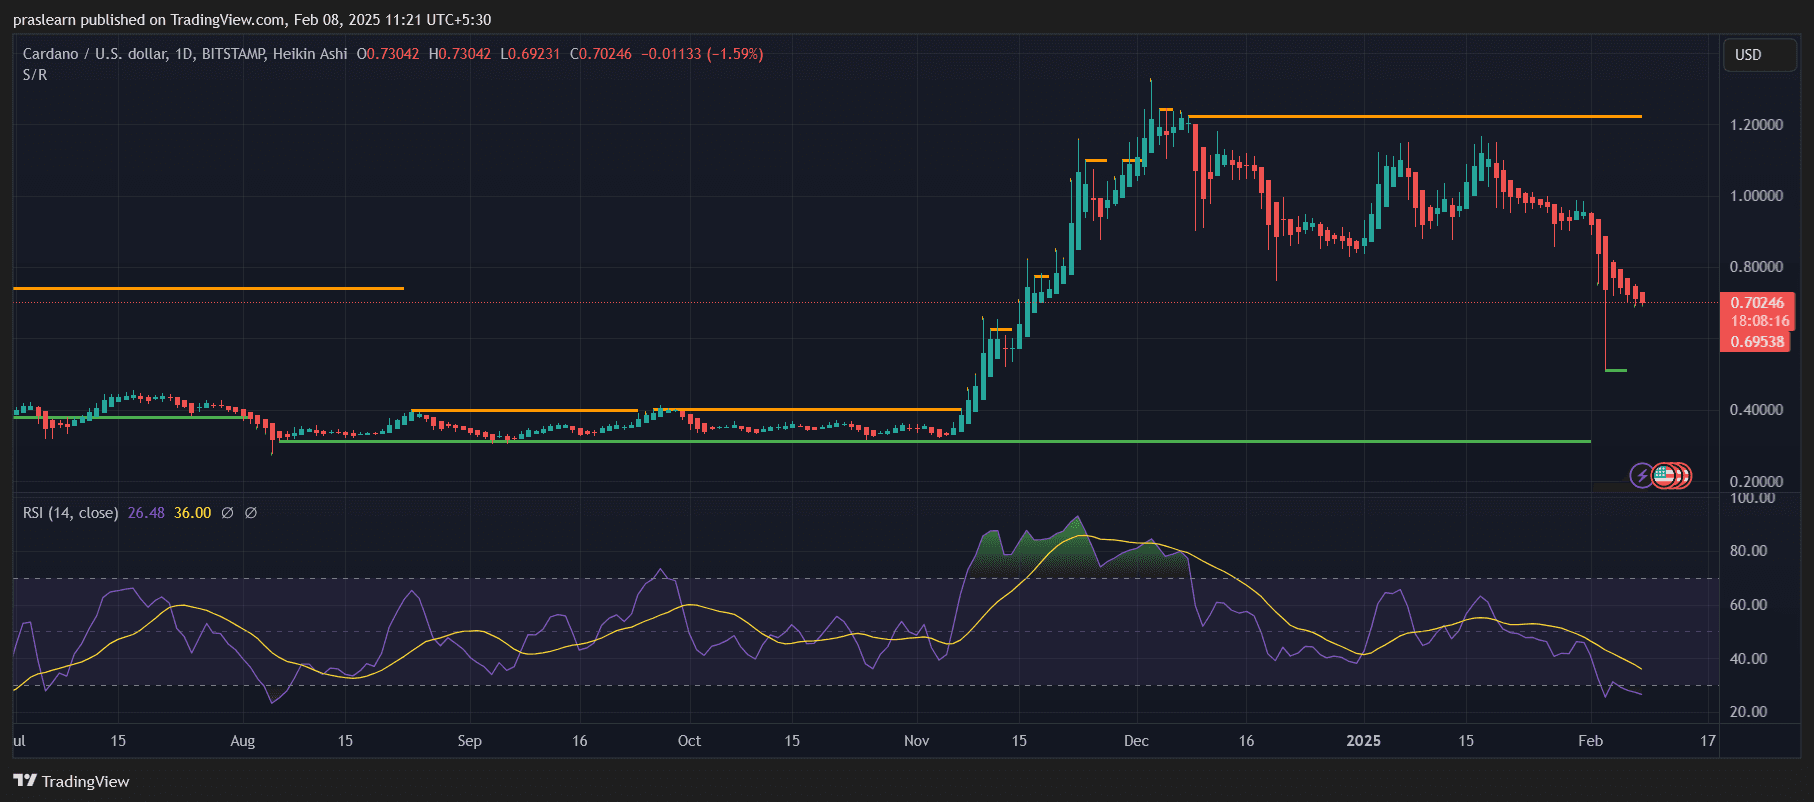 ADA/USD Daily Chart- TradingView
ADA’s recent price action shows a clear rejection from the $1.20 resistance level, followed by a decline that has pushed the price toward the $0.70 region. The break below the previous support near $0.80 indicates that bears are in control, but there are signs that selling pressure could be exhausted.
A key factor to watch is the Relative Strength Index (RSI), which is currently at 26.48, signaling oversold conditions. Historically, when ADA’s RSI falls below 30, a short-term relief rally often follows. If bulls step in at these levels, ADA could see a strong bounce toward the $0.80-$0.85 range before testing further resistance levels.
On the downside, if Cardano Price fails to hold the $0.70 support, the next critical level to watch is $0.50, where long-term buyers could accumulate heavily.
What Are the Key Support and Resistance Levels to Watch?
ADA’s price action has created distinct support and resistance zones that will play a crucial role in determining its next move.
- Support Levels: The immediate support is at $0.70, which must hold to avoid further downside toward $0.50. If ADA falls below $0.50, it could signal a deeper bearish trend, possibly revisiting the $0.30-$0.40 range.
- Resistance Levels: ADA must reclaim $0.85 to regain bullish momentum. A move above this level could see a retest of $1.00, a critical psychological and technical resistance. Beyond that, ADA needs to break past $1.20 for a sustainable rally.
If ADA manages to reclaim these levels, the next key resistance will be at $1.50, which could trigger a larger uptrend.
Cardano Price Prediction: Is ADA Price Oversold and Ready for a Rebound?
The RSI indicator on the daily chart is signaling that ADA is oversold, sitting around 26.48. This suggests that selling pressure could be reaching exhaustion, making a bounce more likely in the short term.
Additionally, ADA’s previous price history has shown that deep corrections often lead to strong recoveries once buying volume returns. If buyers step in aggressively, ADA could see a rapid 20-30% recovery from these levels before encountering major resistance.
However, caution is necessary, as oversold conditions do not always guarantee an immediate reversal. If market sentiment remains bearish, ADA could stay in the lower range for an extended period before showing signs of recovery.
What Could Trigger a Bullish Reversal for ADA Price?
For ADA to regain bullish momentum, several catalysts need to align:
- Strong Buying Volume: A significant increase in volume at the $0.70 support would confirm buyer interest and could push prices higher.
- Break Above $0.85: This would indicate a shift in momentum, signaling that bulls are regaining control.
- Positive Market Sentiment: Broader cryptocurrency market trends, especially Bitcoin’s movement, will play a key role in ADA’s direction. If BTC stabilizes or moves higher, ADA could follow.
- Fundamental Developments: Any major Cardano ecosystem updates, partnerships, or DeFi growth could boost investor confidence and drive prices upward.
If these factors align, Cardano price could stage a strong recovery and move toward $1.20-$1.50 in the coming months.
Cardano Price Prediction: Is ADA a Buy or Wait for Lower Levels?
ADA price is at a critical point where it could either stage a strong recovery or continue its downward slide. The current RSI suggests oversold conditions, increasing the likelihood of a rebound. However, ADA needs to reclaim $0.85-$1.00 to confirm a bullish reversal.
For long-term investors, the current dip could present an attractive entry point, provided they are prepared for potential short-term volatility. Meanwhile, traders should watch the $0.70 support level closely. If it holds, a bounce toward $0.85-$1.00 is possible. However, if ADA breaks below $0.70, further downside toward $0.50 could be on the horizon.
Will ADA recover and reclaim its bullish trend, or is a deeper drop inevitable? The next few weeks will be crucial in determining its next major move.
Disclaimer: The content of this article solely reflects the author's opinion and does not represent the platform in any capacity. This article is not intended to serve as a reference for making investment decisions.
You may also like
New spot margin trading pair — HOLO/USDT!
FUN drops by 32.34% within 24 hours as it faces a steep short-term downturn
- FUN plunged 32.34% in 24 hours to $0.008938, marking a 541.8% monthly loss amid prolonged bearish trends. - Technical breakdowns, elevated selling pressure, and forced liquidations highlight deteriorating market sentiment and risk-off behavior. - Analysts identify key support below $0.0080 as critical, with bearish momentum confirmed by RSI (<30) and MACD indicators. - A trend-following backtest strategy proposes short positions based on technical signals to capitalize on extended downward trajectories.

OPEN has dropped by 189.51% within 24 hours during a significant market pullback
- OPEN's price plummeted 189.51% in 24 hours to $0.8907, marking its largest intraday decline in history. - The token fell 3793.63% over 7 days, matching identical monthly and yearly declines, signaling severe bearish momentum. - Technical analysts cite broken support levels and lack of bullish catalysts as key drivers of the sustained sell-off. - Absence of stabilizing volume or reversal patterns leaves the market vulnerable to further downward pressure.

New spot margin trading pair — LINEA/USDT!