

-
In recent market analysis, Solana (SOL) has showcased critical price levels that could dictate its future movements in the volatile crypto landscape.
-
With the price oscillating near $201, traders must closely watch the $190 and $199 levels for potential breakouts or reversals.
-
According to Hyblock Capital, “The intensity of OI between $190 and $199 suggests that any breakout could lead to a significant price movement,” highlighting the importance of these zones.
Explore the critical price levels for Solana (SOL) as key support and resistance zones emerge, signaling potential market movements ahead.
Understanding Solana’s Key Price Levels
Solana’s recent Open Interest (OI) heatmap has identified pivotal levels that every trader should consider. Significantly, the support at $190 has proven resilient, characterized by a robust accumulation of OI.
This support has repeatedly attracted buyers, indicating a strong interest at this price point and preventing further price declines.
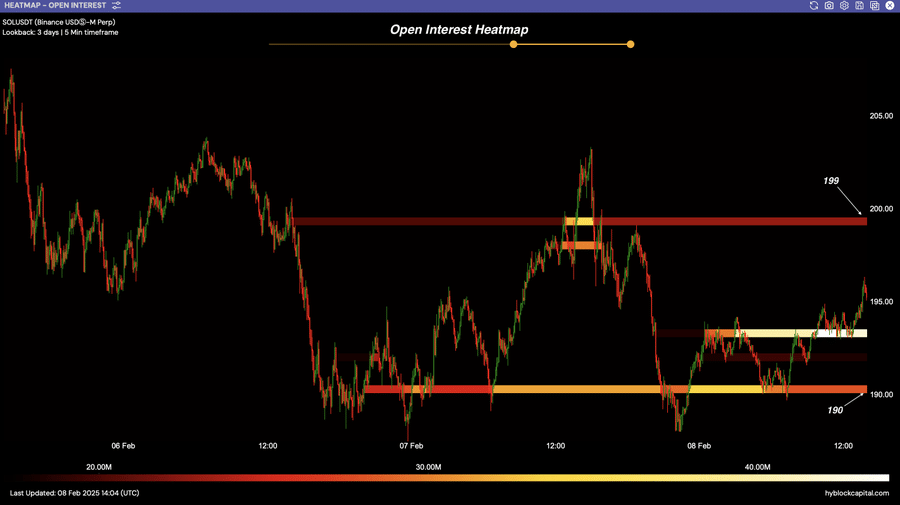
Source: Hyblock Capital
On the opposing end, $199 has acted as a significant barrier, previously representing heavy resistance illustrated by concentrated sell orders. The market has seen repeated attempts to breach this level, underscoring the contention between bull and bear traders.
However, following SOL’s recent price movements above $199, this resistance could potentially transition into a support zone if the breakout sustains momentum, revealing new trading opportunities.
The concentration of OI between these two critical levels indicates that a decisive breakout could trigger notable price fluctuations.
Anticipating Market Reactions at Crucial Levels
As it stands, the $190 level remains a significant support zone bolstered by noteworthy OI accumulation. Such clustering signals heightened buying activity, making it an attractive point for traders looking for entry opportunities.
Past performance indicates that Solana typically rebounds from similar thresholds, suggesting a chance for recovery provided buyer momentum remains robust.
Nonetheless, a failure to uphold this support may incite a re-evaluation of lower levels, which could lead to escalated sell-offs, particularly from leveraged positions.
Conversely, if the previously resisted $199 level can sustain itself as support, it presents an opportunity for a bullish thrust towards higher price targets like $205.
A failure to maintain this level, however, might lead to market consolidation or a potential downturn back to the critical support at $190.
Utilizing OI Data for Enhanced Trading Strategies
With Solana presently trading at $201, the recent breakout above the crucial resistance at $199 signifies a potential bullish trend, yet traders are advised to proceed with caution.
If the $199 mark holds as support, it could catalyze a move upwards; however, any slip below this threshold could point to a false breakout and return traders to the $190 support zone.
By tracking OI data, traders can detect spikes in OI above newly established levels, such as $205, aiding in identifying further resistance or profit-taking points.
Should SOL revisit below $199, it is likely that this could trigger a cascade effect, leading to a re-test of the $190 support.
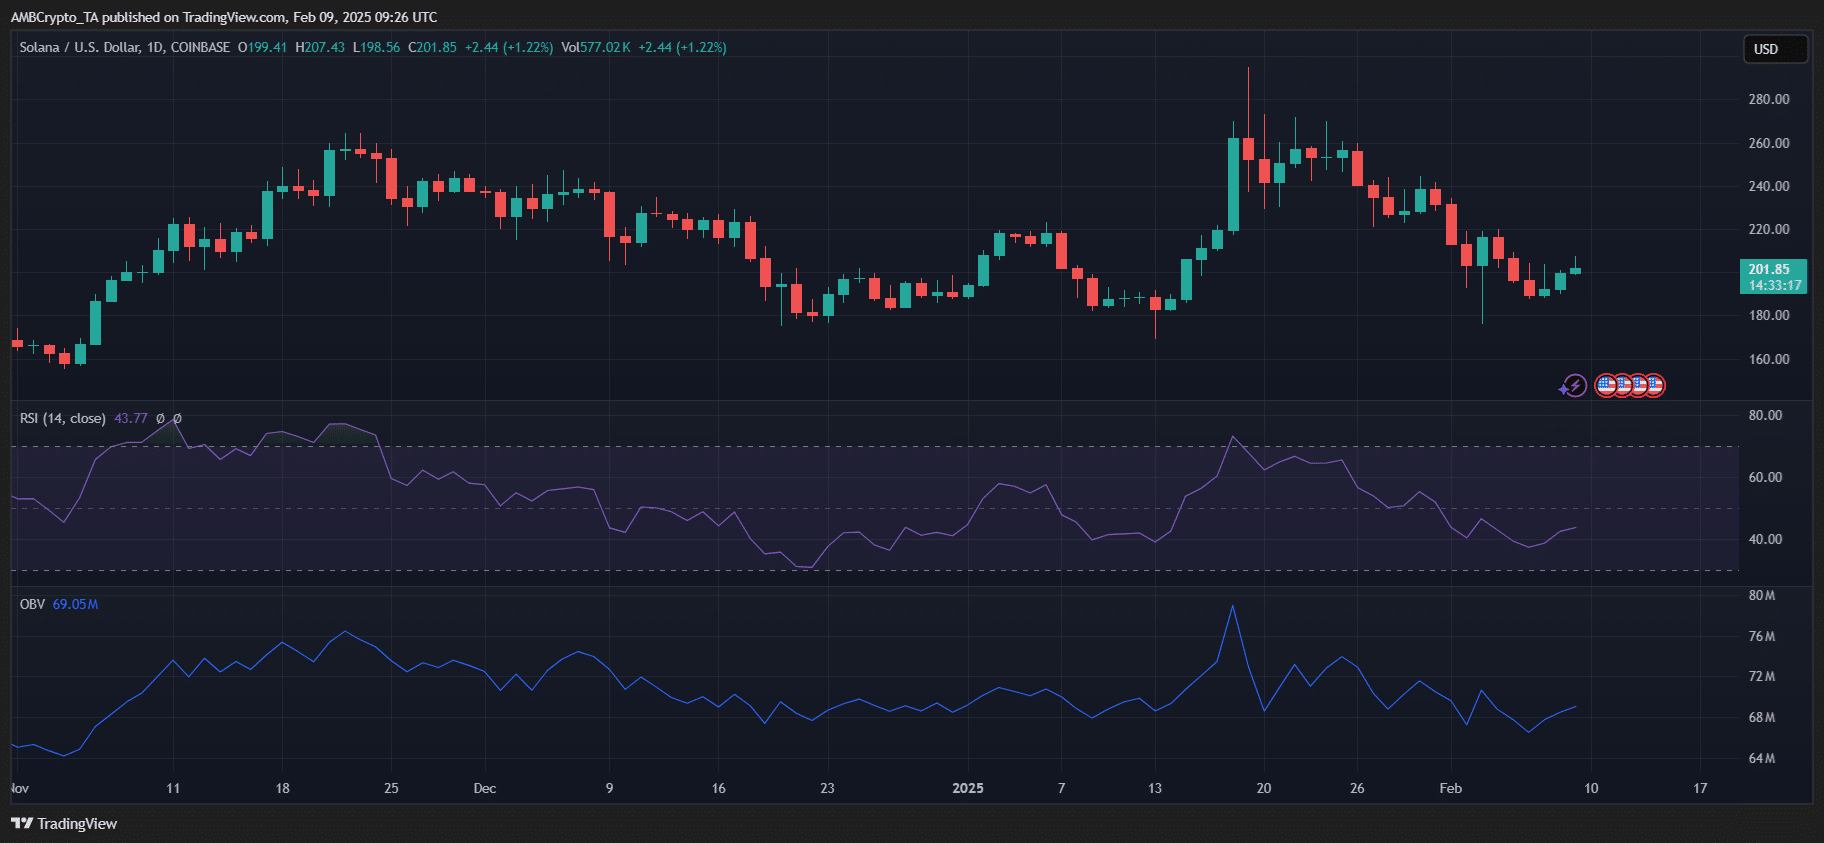
Source: TradingView
Keep an eye on Solana’s [SOL] Price Prediction for 2025–2026.
Current indicators show the RSI at 43.77, pointing towards mildly bearish momentum, while the OBV stands at 69.05M, indicating consistent market interest.
The ongoing price action suggests that a rally could be plausible if trading volumes exceed $201. Therefore, traders are encouraged to monitor consolidation events above $199, which may validate the strength of the prevailing bullish trend.
Conclusion
In summary, as Solana navigates critical price points at $190 and $199, traders should stay alert for potential breakout opportunities or pitfalls. The current market volatility accentuates the need for careful analysis, leveraging OI data to make informed decisions as the landscape evolves.

