

Technical indicators suggest Solana (SOL) is about to experience significant price fluctuations amid an upcoming symmetrical triangle pattern breakout.
A Solana price confirmation could boost its value by 13% while capturing market trader and investor interest.
The upper resistance line is $34, while the lower support line is $31.50. When the symmetrical triangle apex is reached, price volatility typically rises, which could result in a future breakout.
When the market exceeds $34, a 13% Solana price increase would become possible.
Based on this price prediction, the upcoming resistance target points to approximately $38.50.
When SOL drops below $31.50, it may fall to reconfirm the $29 support area.
Prices Still struggling
According to the charts, the SOL/USD movement during the last 4 hours shows bearish patterns.
The cryptocurrency market has caused SOL prices to plunge 9.24% since yesterday to reach a point of $151.75.
The market displayed powerful selling pressure, which triggered a price decrease while the trading volume reached $2.54 billion, marking an increase of 46.01%.
The marketplace capitalization value experienced a 9.24% decrease, thus mirroring the general market sentiment.
The value plummeted by $11 from its initial position of $170 during one 24-hour period to $159 and then to $151.
A straight fall reflects bearish momentum since the price shows no recovery during the downfall.
The price chart demonstrates how it broke through previous support levels, which indicates that the downward trend will continue.
Indicator candles display an extended period of red color, showing consistent selling force. The market shows no signs of buying activity to stop this declining pattern.
The declining analyst charts demonstrate an ongoing downtrend because the market value exceeds the critical $189.31 resistance point.
A sequence of decreasing price highs throughout the market creates bearish momentum indications.
Numerous rejection points shown with red arrows reveal the heightened marketplace selling activity found near resistance areas.
The bearish attitude is supported by the current price level breaking below $175.26 support as traders await the central support area extending from $126.36 to $112.36.
Based on current market structures, the analyst predicts SOL will face increasing bearish market conditions in the next March.
Solana Charts Showing Bear Waters
The SMAs show a bearish trend because their crossover pattern puts the shorter-time frame average below the longer-term average.
The price shows resistance at the current moving averages, indicating a strong barrier at $174.30.
The selling interest throughout this zone will prevent most recovery attempts from reaching this price area.
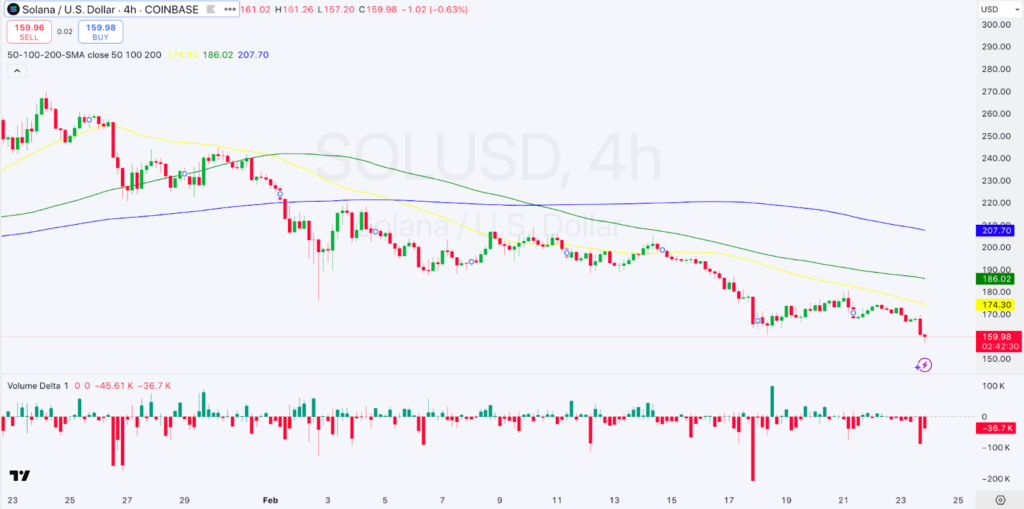 4-hour SOL/USD Chart | Source: TradingView
Sellers control the market because negative volume bars occupy most of the space in the bottom portion of the second image.
Price falls sharply during times of intense negative selling activity, thus extending the current bearish market trend.
The absence of green volume bars shows low buyer participation, which confirms the bearish market performance.
The $159 price stands as the market’s present short-term protection point.
This support level for Solana becomes more prone to failure because there is currently insufficient market demand.
The $150 area serves as potential temporary support after the initial support breakdown.
The bearish forecast would only be challenged at a $174.30 breakpoint. However, this seems improbable for the upcoming period because of recent momentum dynamics.