

Date: Fri, February 28, 2025 | 11:25 AM GMT
The cryptocurrency market is facing a major sell-off today, triggering panic among investors. Bitcoin (BTC) has dropped to $80,000 from its all-time high (ATH) of $110,000, while Ethereum (ETH) has plunged to $2,100.
Kaspa (KAS) has not been spared in this downturn, suffering a 12% daily drop, extending its monthly losses to 28%.
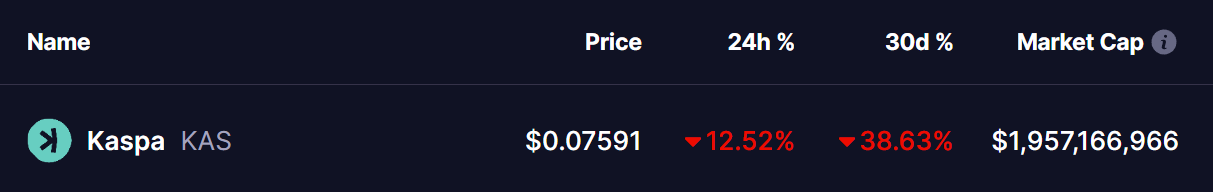 Source: Coinmarketcap
The token has now reached a critical support zone, and technical indicators suggest the risk of further decline.
Head & Shoulders Signals Trouble
The weekly chart for Kaspa (KAS) highlights a Head & Shoulders pattern, a classic bearish reversal formation. The rejection from the right shoulder triggered a sharp breakdown from the neckline (blue shaded area), pushing KAS toward its key support level at $0.072 (red line). This zone has previously acted as a strong rebound area.
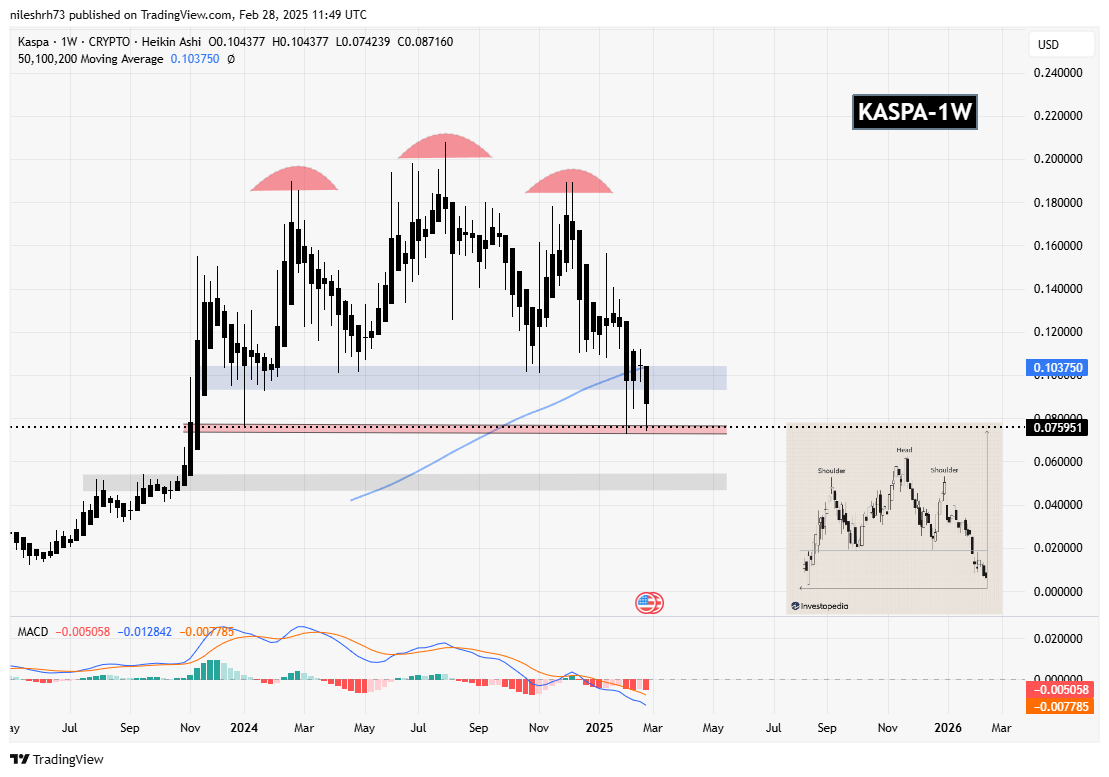 Kaspa (KAS) Weekly Chart/Coinsprobe (Source: Tradingview)
Currently, KAS is holding this support and is trading at $0.075. A bounce from here could see the price recover toward the neckline resistance, potentially signaling a short-term relief rally.
However, the overall structure remains bearish. If KAS fails to sustain above this critical level, the next downside target lies at $0.054 (gray shaded zone), representing a further drop of nearly 28%.
The MACD indicator on the chart is flashing bearish signals. The MACD line has crossed below the signal line, confirming increasing selling momentum. If this trend persists, KAS could struggle to reclaim higher levels.
Final Thoughts
Kaspa (KAS) is currently at a make-or-break support level. While a bounce is possible, the prevailing Head & Shoulders breakdown and bearish MACD suggest that further downside risk remains high. A sustained drop below $0.072 could open doors for a deeper correction toward $0.054.
Traders should watch for rebound confirmations before making any decisions, while also monitoring broader market conditions, especially Bitcoin and Ethereum price action.
Disclaimer: This article is for informational purposes only and does not constitute financial advice. Always conduct your own research before investing in cryptocurrencies.