What’s Next for XRP After Its Surge to $3? Ripple Price Analysis

Much like Bitcoin and other large-cap crypto assets, XRP experienced a massive price surge yesterday, spreading optimism among the investors hoping that the bull market is not over.
By Edris Derakhshi (TradingRage)
The USDT Paired Chart
On the daily chart of the USDT pair, the third-largest crypto has rebounded decisively from the $2 support level, quickly running into the $3 resistance level in a day, marking an almost 50% price increase.
However, the market is now getting rejected from the $3 area, and if it fails to break it to the upside soon, another bearish wave could push the price lower toward the 200-day moving average, which is currently located around the $1.6 mark.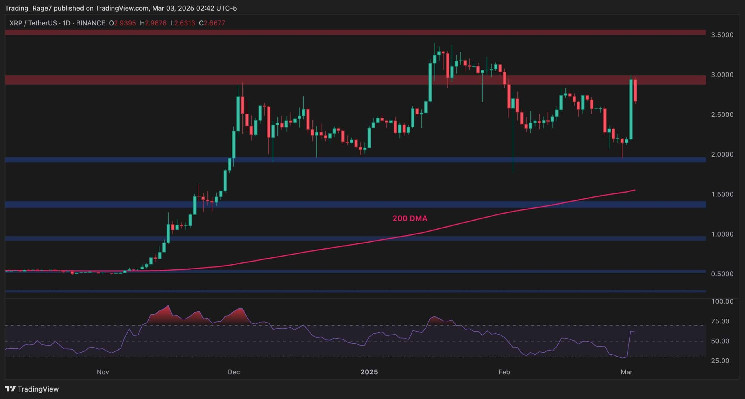
The BTC Paired Chart
XRP/BTC’s daily chart looks much better than the USDT pair, as the asset has already broken above the key 2,800 SAT level and closed above it.
However, today’s price action is corrective, as a pullback to the 2,800 SAT zone looks very likely in the short term. If the level holds, the market will find its base to launch another attack toward the 3,400 SAT resistance area in the coming weeks.
Disclaimer: The content of this article solely reflects the author's opinion and does not represent the platform in any capacity. This article is not intended to serve as a reference for making investment decisions.
You may also like
XRP Faces Trendline Pressure While Ethereum Could Target $5,000 and Bitcoin Eyes Resistance

Tron Gas Fee Cut May Boost Adoption but Could Reduce Short‑Term Revenue


Hayes Suggests Bitcoin Could Be Increasingly Correlated With Stocks, Gold and the U.S. Dollar