

Bitcoin‘s daily chart scrutiny unveils a prolonged uptrend birthed in late 2024, peaking near $109,356 per BTC before retreating. The $85,000–$90,000 band now functions as a gravitational anchor, aligning with recent recovery patterns. Overhead friction lingers at $100,000–$109,000, where historic rallies stalled. Volume dissection reveals amplified sell-offs during declines, followed by cautious accumulation, illustrating investor circumspection. A protracted equilibrium within this range might reignite attempts to probe loftier resistance frontiers.

BTC/USD 1D chart via Bitstamp on March 5, 2025.
On the 4-hour chart, bitcoin has rallied from a trough of $78,197, stabilizing near $90,000. The $85,000 level emerges as a linchpin, while the $92,000–$95,000 zone solidifies as a springboard for bullish ambition. Though buying activity escalates, skepticism simmers as traders debate bitcoin’s capacity to anchor above $90,000. A forceful breach of resistance could unlock fresh upside vistas, while slippage below $88,000 risks revisiting deeper support trenches.
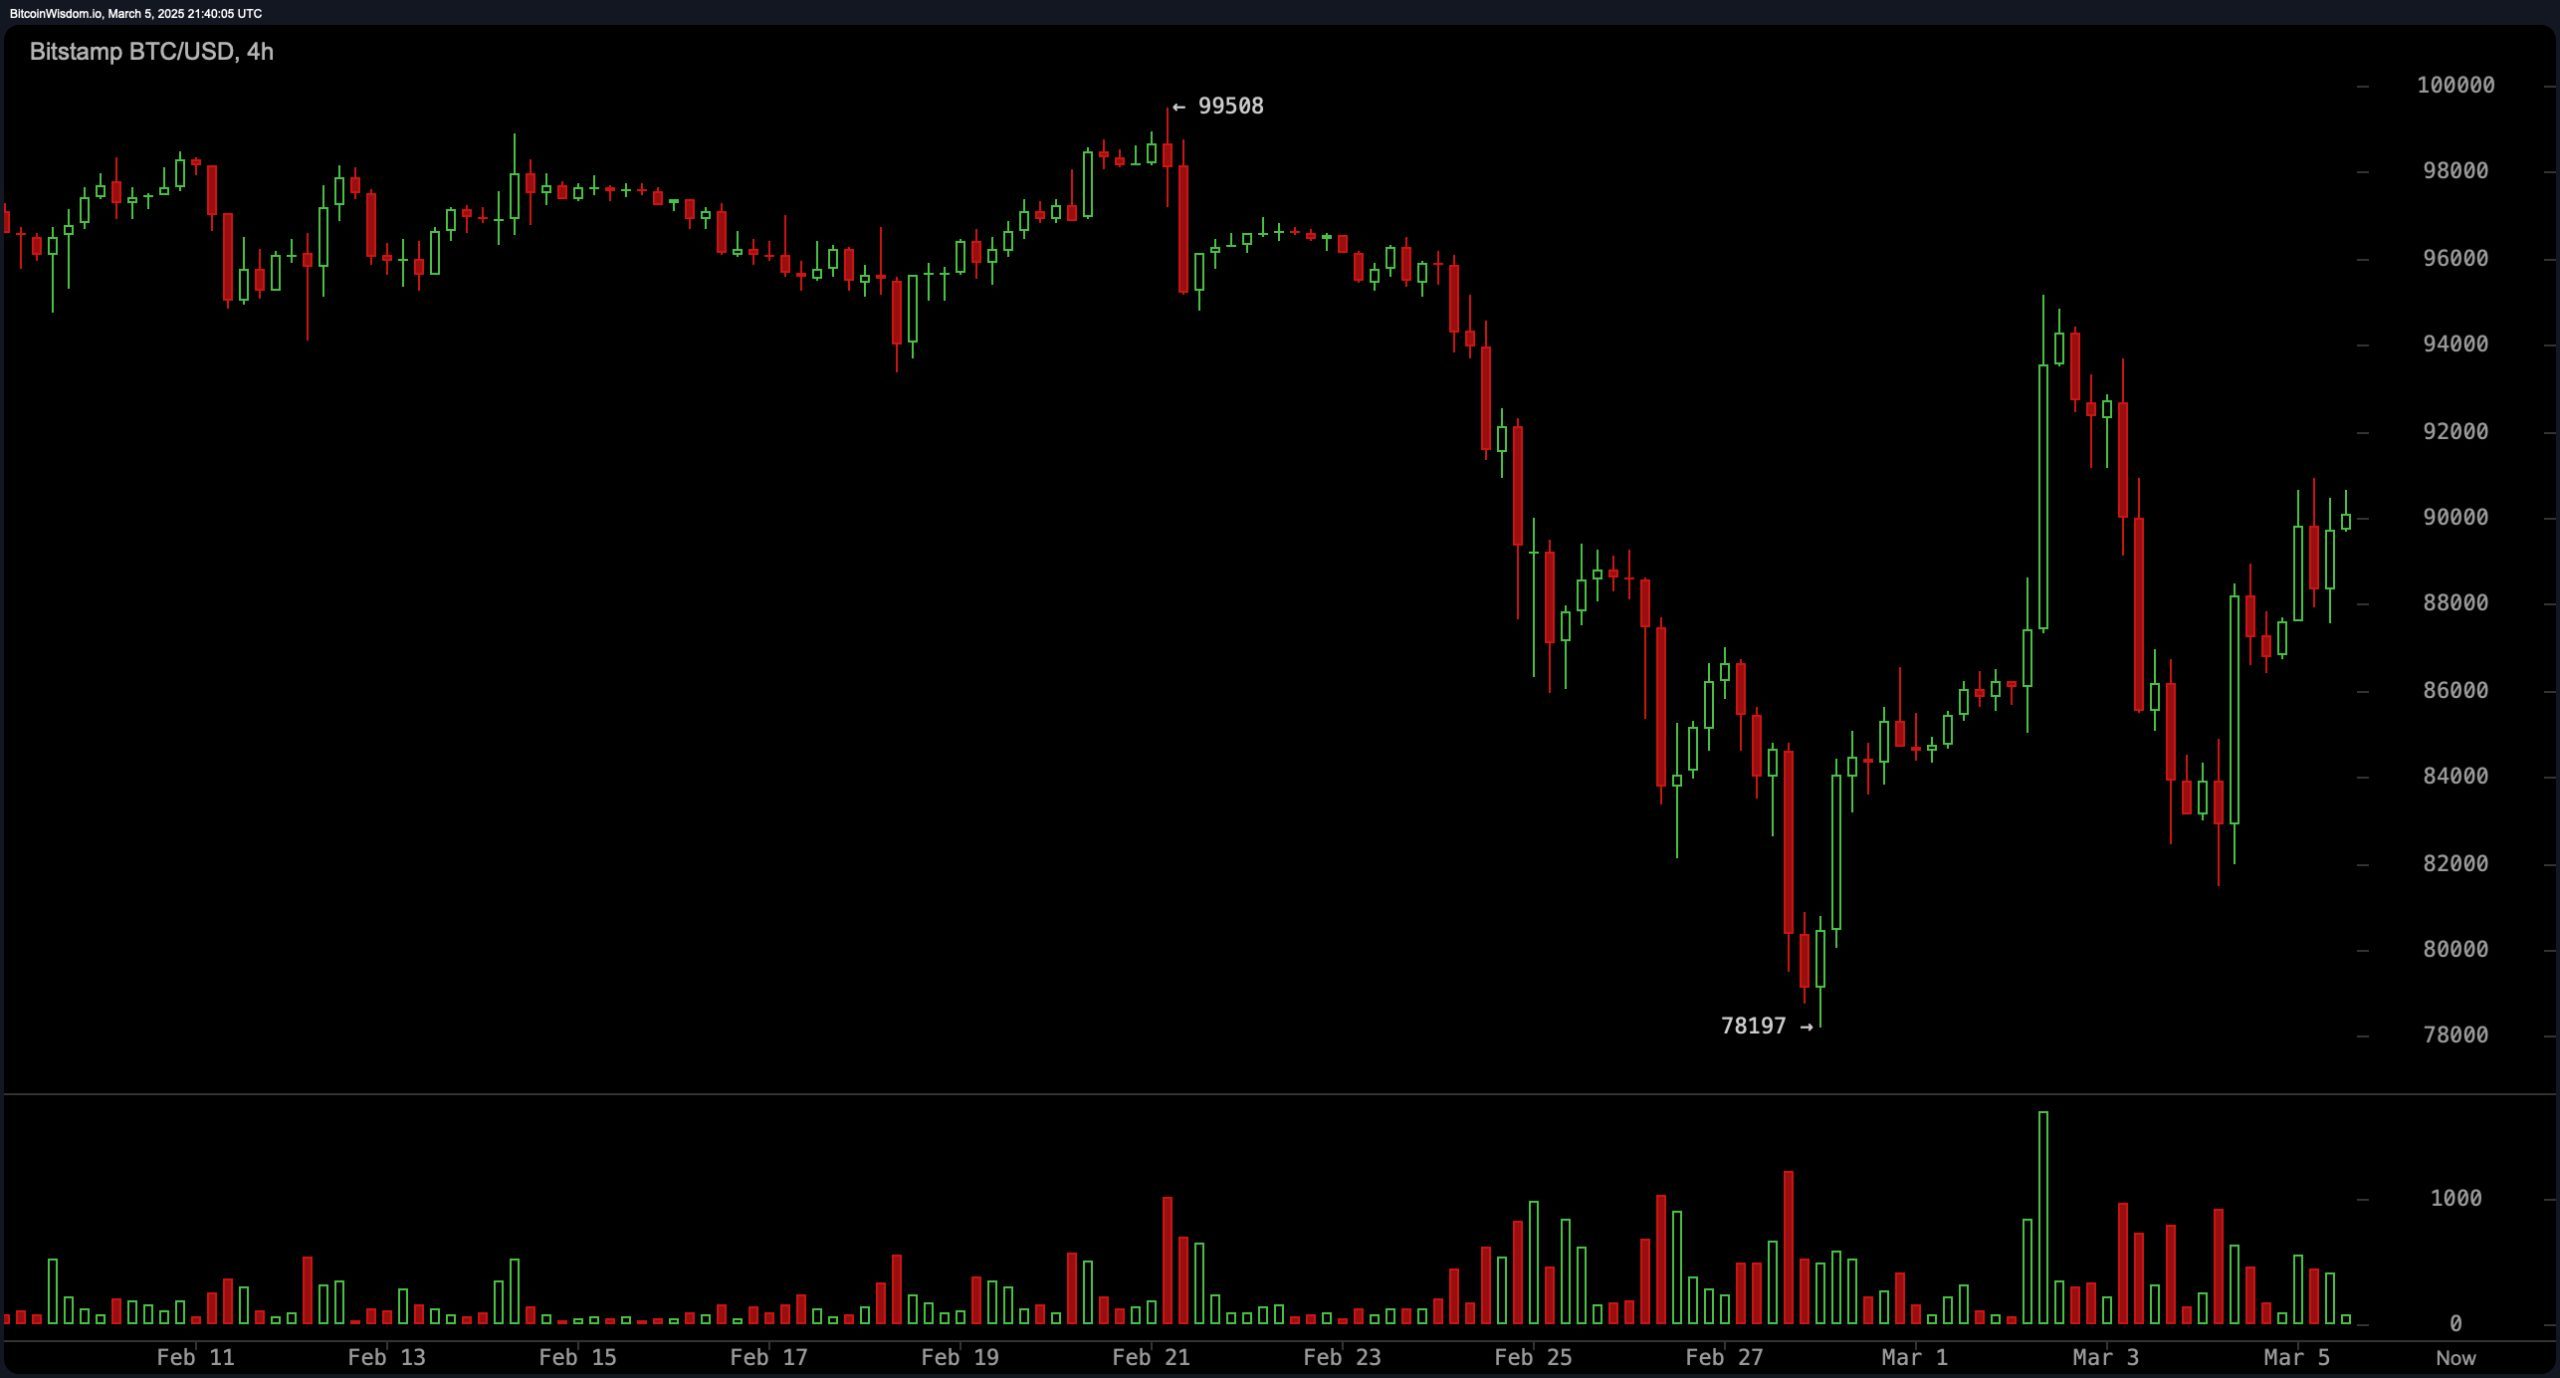
BTC/USD 4H chart via Bitstamp on March 5, 2025.
The 1-hour chart flaunts a fleeting bullish charge, propelling bitcoin prices toward $90,000. Immediate resistance looms at $94,000–$95,000, a zone of prior rejection. The $88,000 support remains pivotal for sustaining momentum. Reclaiming $94,000 per BTC might catalyze a sprint toward $95,000 and beyond, whereas faltering below $88,000 could unravel gains, testing sturdier downside buffers.
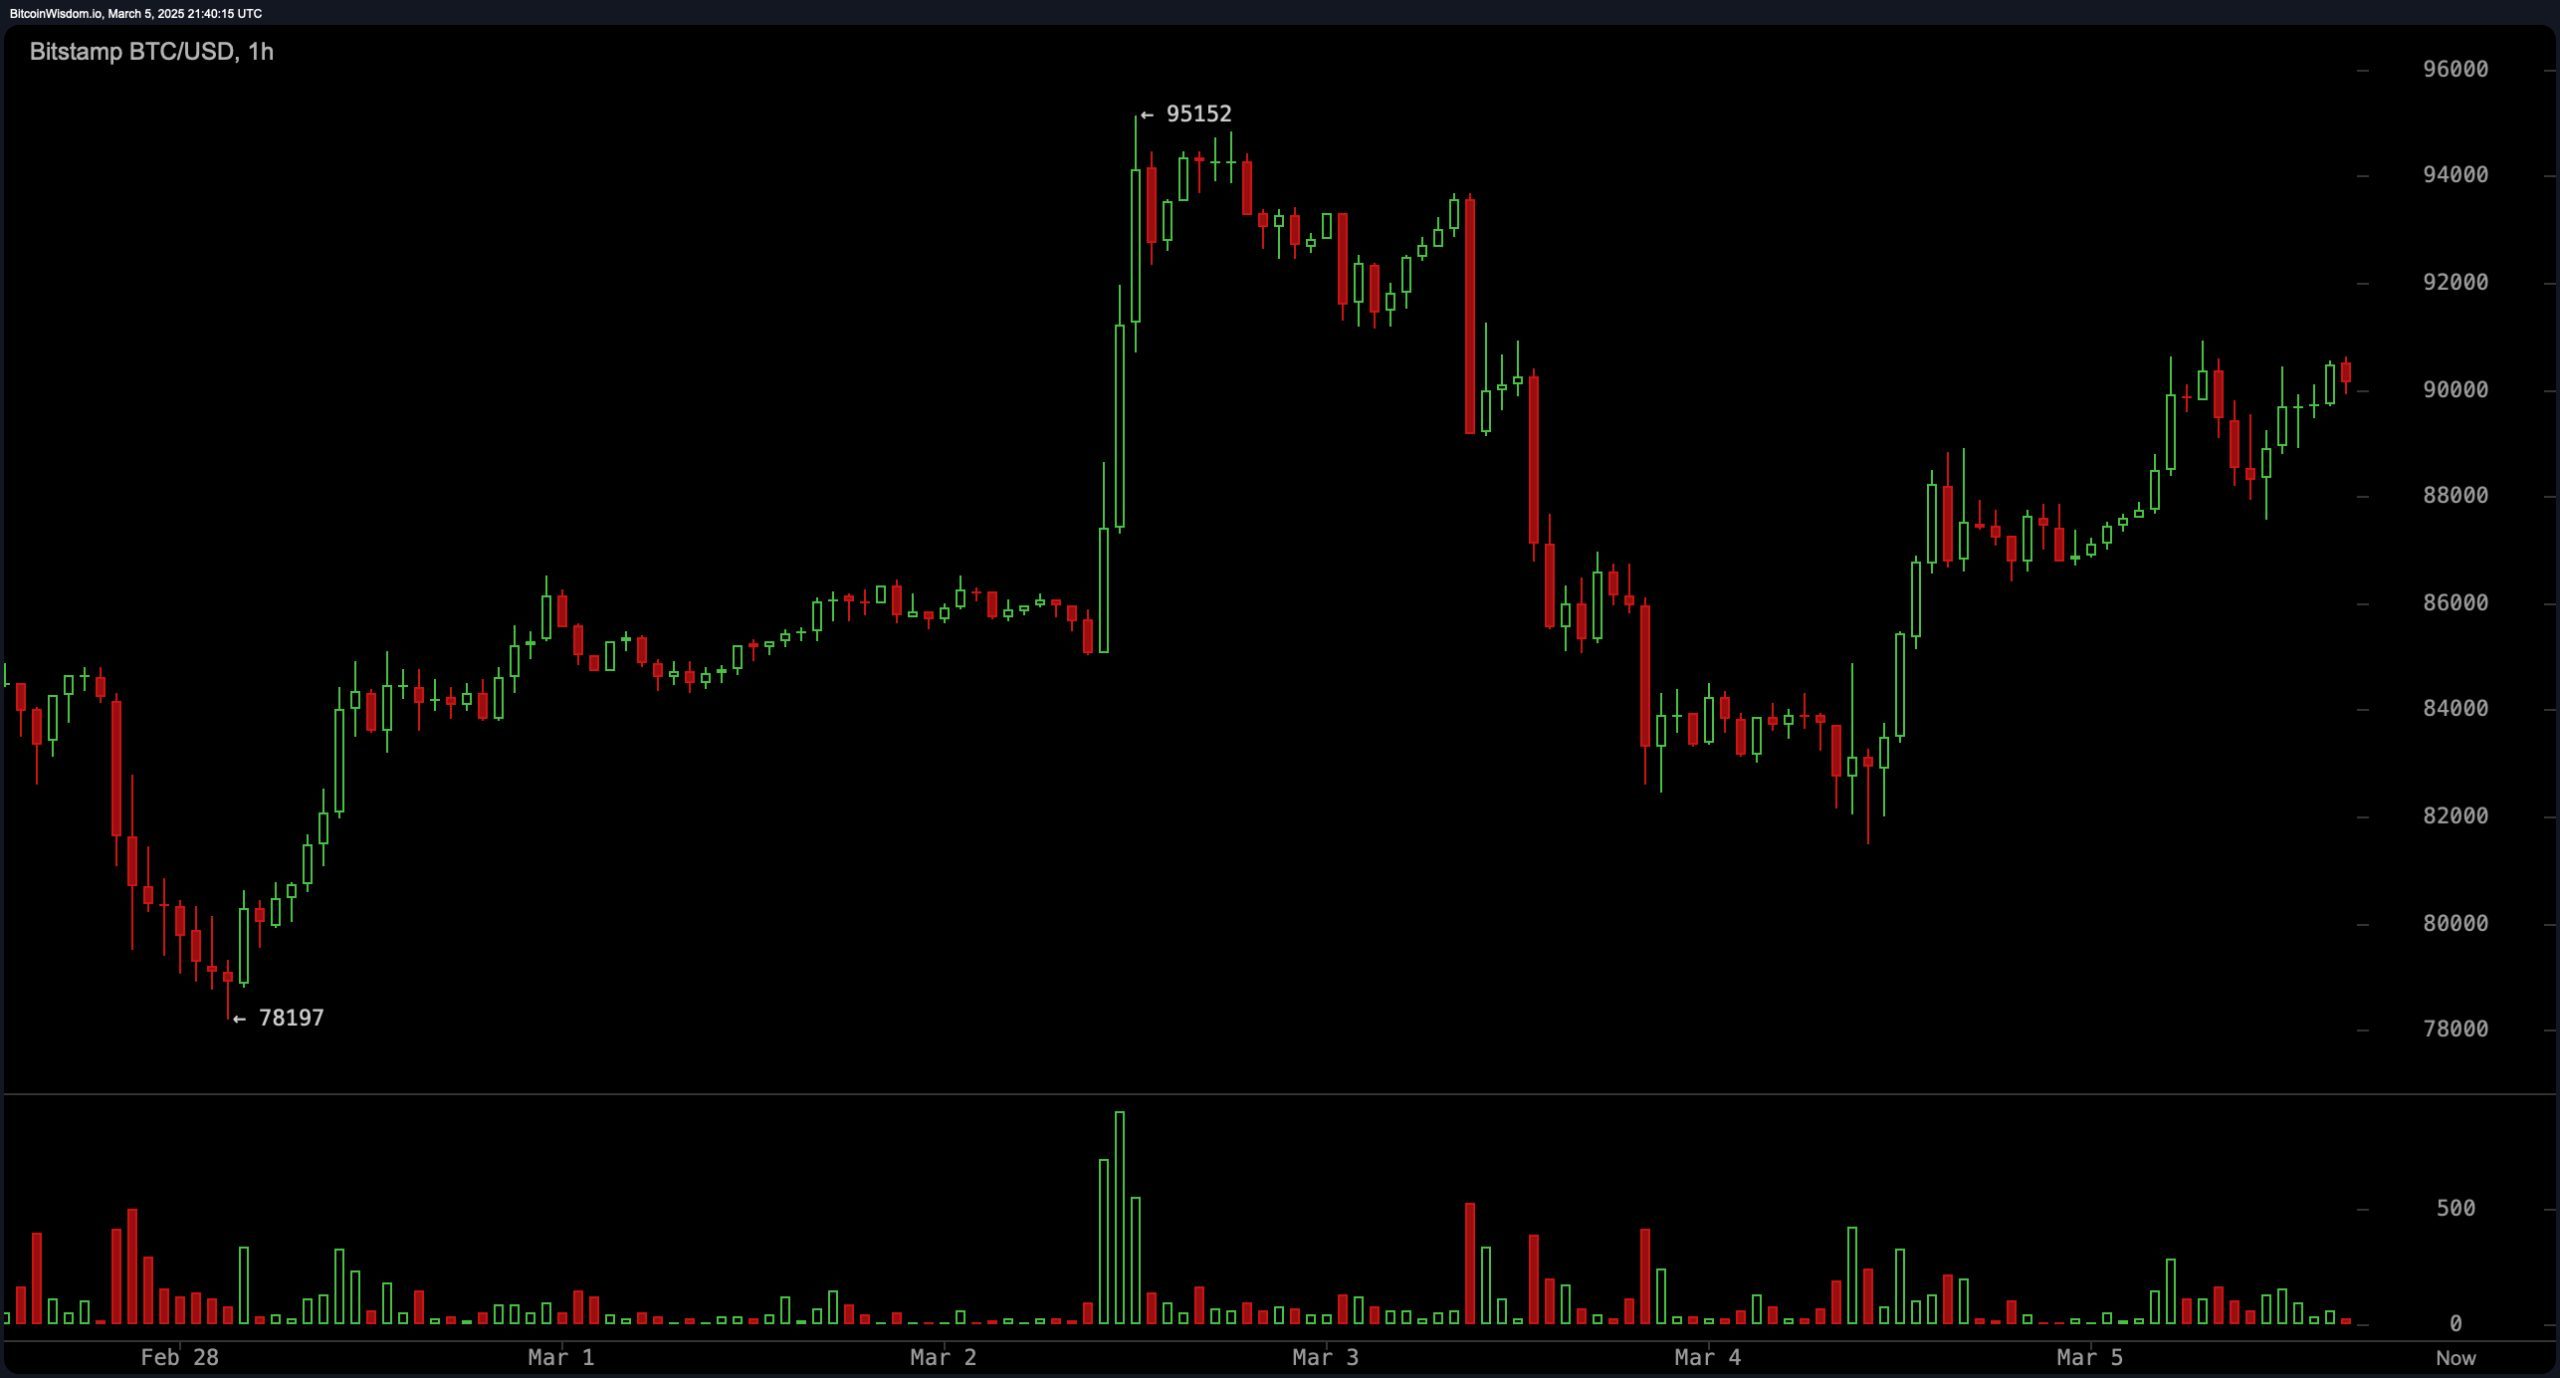
BTC/USD 1H chart via Bitstamp on March 5, 2025.
The daily chart’s oscillators telegraph neutrality: the relative strength index (RSI) at 46, alongside the Stochastic, commodity channel index (CCI), and awesome oscillator, reflect equipoise. The momentum indicator’s -6,137 reading flashes a bullish signal, while the moving average convergence divergence (MACD) at -2,711 whispers of residual bearish tension. Moving averages (MAs) diverge: short-term gauges like the exponential moving average (EMA 10) at $89,207 and simple moving average (SMA 10) at $87,699 tilt bullish, while extended-period EMAs and SMAs (20 to 100) lean bearish, reinforcing resistance ceilings.
Fibonacci retracement levels delineate pivotal thresholds. The 38.2% marker at $90,069 serves as a fulcrum, with sturdier support at the 50% ($84,111) and 61.8% ($78,153) tiers. A decisive leap above $92,500 could ignite a rally toward the 23.6% retracement at $97,440, while a slump below $85,000 might rekindle downward momentum. In this stalemate, bitcoin’s trajectory hinges on either consolidating support for renewed ascension or capitulating to bearish forces eyeing lower Fibonacci footholds.
Bull Verdict:
Bitcoin’s ability to sustain levels above $88,000, coupled with buying signals from short-term moving averages, suggests a potential breakout toward $95,000 and beyond. If bullish momentum continues and volume supports an upward move, a retest of the $100,000 resistance zone could be imminent, reinforcing a long-term uptrend continuation.
Bear Verdict:
Despite recent stability, bitcoin faces strong resistance in the $92,000–$95,000 range, while longer-term moving averages and the moving average convergence divergence (MACD) indicate lingering selling pressure. If bitcoin fails to hold $88,000, a retest of $85,000 or even the 61.8% Fibonacci retracement at $78,153 could be in play, signaling a deeper correction before any potential recovery.
免责声明:本文章仅代表作者个人观点,不代表本平台的立场和观点。本文章仅供信息分享,不构成对任何人的任何投资建议。用户与作者之间的任何争议,与本平台无关。如网页中刊载的文章或图片涉及侵权,请提供相关的权利证明和身份证明发送邮件到support@aicoin.com,本平台相关工作人员将会进行核查。