Bitget App
Trade smarter
Buy cryptoMarketsTradeFuturesEarnWeb3SquareMore
Trade
Spot
Buy and sell crypto with ease
Margin
Amplify your capital and maximize fund efficiency
Onchain
Going Onchain, without going Onchain!
Convert & block trade
Convert crypto with one click and zero fees
Explore
Launchhub
Gain the edge early and start winning
Copy
Copy elite trader with one click
Bots
Simple, fast, and reliable AI trading bot
Trade
USDT-M Futures
Futures settled in USDT
USDC-M Futures
Futures settled in USDC
Coin-M Futures
Futures settled in cryptocurrencies
Explore
Futures guide
A beginner-to-advanced journey in futures trading
Futures promotions
Generous rewards await
Overview
A variety of products to grow your assets
Simple Earn
Deposit and withdraw anytime to earn flexible returns with zero risk
On-chain Earn
Earn profits daily without risking principal
Structured Earn
Robust financial innovation to navigate market swings
VIP and Wealth Management
Premium services for smart wealth management
Loans
Flexible borrowing with high fund security
Are FET and WLD Gearing Up for a Recovery? Analyst Spots Key Harmonic Patterns

Are FET and WLD Gearing Up for a Recovery? Analyst Spots Key Harmonic Patterns

CoinsProbeCoinsProbe2025/03/07 20:00
By:Nilesh Hembade

Date: Fri, March 07, 2025 | 11:40 AM GMT

The cryptocurrency market remains in a downtrend phase following the November rally. The downturn has sent bearish momentum across altcoins, and two of the biggest losers have been Artificial Superintelligence Alliance (FET) and Worldcoin (WLD), both of which have plummeted by over 60% in the last 60 days.

Are FET and WLD Gearing Up for a Recovery? Analyst Spots Key Harmonic Patterns image 0 
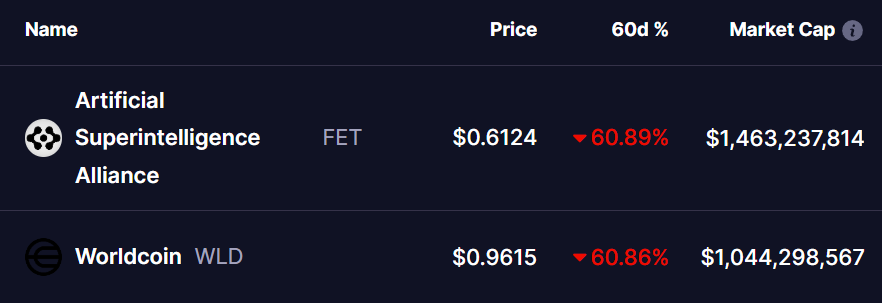
Source: Coinmarketcap

However, a potential reversal might be on the horizon as renowned crypto analyst Shelby has identified key harmonic patterns forming in both assets, signaling a possible trend reversal.

Artificial Superintelligence Alliance (FET)

FET has been trading in a prolonged downtrend since its December peak of $2.16, with the price reaching as low as $0.55. Despite the bearish sentiment, a bullish Shark pattern has emerged, which typically suggests that the asset is approaching a significant support zone.

FET Daily Chart/Source: @CryptoNewton (X)

This harmonic structure, completed at point D, suggests that FET could soon see a strong rebound. The next key target for FET lies at $1.08, aligning with previous resistance levels. If momentum builds up and buying pressure sustains, FET could extend gains toward $1.43-$1.65, marking a potential 170% upside from current levels.

Worldcoin (WLD)

Worldcoin has followed a similar trajectory, suffering a sharp decline from its December highs near $4.19 to a recent low around $0.87. The chart shows a completed Deep Crab harmonic pattern, a classic reversal signal often associated with sharp bounces.

WLD Daily Chart/Source: @CryptoNewton (X)

The pattern suggests that WLD has reached its exhaustion point, with the next major resistance standing at $2.92. If WLD manages to reclaim this level, the next significant hurdle would be the $4.00 range, which could mark a 330% increase from current prices.

Final Thoughts

While the broader market remains uncertain, the formation of these bullish harmonic patterns on FET and WLD offers a glimmer of hope for traders looking for a potential recovery. These patterns historically indicate strong reversal zones, but confirmation from volume and broader market sentiment will be key.

As always, investors should remain cautious, conduct their own research, and manage risks effectively.

Disclaimer: This article is for informational purposes only and not financial advice. Always conduct your own research before making investment decisions.

0

Disclaimer: The content of this article solely reflects the author's opinion and does not represent the platform in any capacity. This article is not intended to serve as a reference for making investment decisions.

PoolX: Earn new token airdrops
Lock your assets and earn 10%+ APR
Lock now!

You may also like

FUN drops by 32.34% within 24 hours as it faces a steep short-term downturn

- FUN plunged 32.34% in 24 hours to $0.008938, marking a 541.8% monthly loss amid prolonged bearish trends. - Technical breakdowns, elevated selling pressure, and forced liquidations highlight deteriorating market sentiment and risk-off behavior. - Analysts identify key support below $0.0080 as critical, with bearish momentum confirmed by RSI (<30) and MACD indicators. - A trend-following backtest strategy proposes short positions based on technical signals to capitalize on extended downward trajectories.

Bitget-RWA2025/09/12 06:14
FUN drops by 32.34% within 24 hours as it faces a steep short-term downturn

OPEN has dropped by 189.51% within 24 hours during a significant market pullback

- OPEN's price plummeted 189.51% in 24 hours to $0.8907, marking its largest intraday decline in history. - The token fell 3793.63% over 7 days, matching identical monthly and yearly declines, signaling severe bearish momentum. - Technical analysts cite broken support levels and lack of bullish catalysts as key drivers of the sustained sell-off. - Absence of stabilizing volume or reversal patterns leaves the market vulnerable to further downward pressure.

Bitget-RWA2025/09/12 06:14
OPEN has dropped by 189.51% within 24 hours during a significant market pullback

New spot margin trading pair — LINEA/USDT!

Bitget Announcement2025/09/11 10:04