Bitget App
Trade smarter
Buy cryptoMarketsTradeFuturesEarnWeb3SquareMore
Trade
Spot
Buy and sell crypto with ease
Margin
Amplify your capital and maximize fund efficiency
Onchain
Going Onchain, without going Onchain!
Convert & block trade
Convert crypto with one click and zero fees
Explore
Launchhub
Gain the edge early and start winning
Copy
Copy elite trader with one click
Bots
Simple, fast, and reliable AI trading bot
Trade
USDT-M Futures
Futures settled in USDT
USDC-M Futures
Futures settled in USDC
Coin-M Futures
Futures settled in cryptocurrencies
Explore
Futures guide
A beginner-to-advanced journey in futures trading
Futures promotions
Generous rewards await
Overview
A variety of products to grow your assets
Simple Earn
Deposit and withdraw anytime to earn flexible returns with zero risk
On-chain Earn
Earn profits daily without risking principal
Structured Earn
Robust financial innovation to navigate market swings
VIP and Wealth Management
Premium services for smart wealth management
Loans
Flexible borrowing with high fund security
Toncoin (TON) Testing Make or Break Support – Rebound or Further Decline?

Toncoin (TON) Testing Make or Break Support – Rebound or Further Decline?

CoinsProbeCoinsProbe2025/03/08 12:33
By:Nilesh Hembade

Date: Sat, March 08, 2025 | 08:02 AM GMT

The cryptocurrency market remains in a corrective phase following the November rally. One of the hardest-hit altcoins in this downturn has been Toncoin (TON), which has suffered a sharp 47% correction over the past two months.

Currently, TON is trading around $2.96, marking a 2% decline that has brought it to a critical “Make or Break” support level.

Toncoin (TON) Testing Make or Break Support – Rebound or Further Decline? image 0 
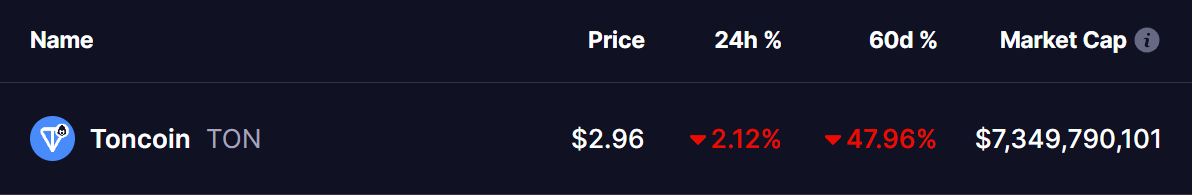
Source: Coinmarketcap

Testing Ascending Channel Support

The weekly chart shows that Toncoin has been trading within a broader ascending channel since the bull market of 2021. However, the recent rejection from the upper boundary at $8.28 in mid-2024 triggered a substantial correction.

Toncoin (TON) Weekly Chart/Coinsprobe (Source: Tradingview)

The ongoing sell-off has driven TON’s price down to $2.96, which aligns with the ascending channel’s lower support trendline. In previous instances, TON has bounced from this level, and if history repeats itself, a rebound could be in play.

If TON holds this support, the next significant challenge will be the 150-day and 100-day moving averages. A breakout above these levels would confirm renewed buying strength, potentially setting up a recovery rally toward previous range highs.

However, failure to hold this support could lead to another wave of selling, with the next downside targets at $2.55 and $1.88.

The MACD indicator remains in bearish territory, with the MACD line below the signal line, indicating continued selling pressure. However, if momentum shifts and the MACD starts turning upwards, it could signal an early reversal, making TON’s reaction at this support level even more crucial.

Final Thoughts

Toncoin is at a pivotal point, testing the lower boundary of its long-term ascending channel. If bulls defend this level, a rebound could be in store, with a move toward key moving averages acting as the next hurdle. However, if this support breaks, further downside toward $2.55 and $1.88 could follow. The coming days will be crucial in determining TON’s next major move.

Disclaimer: This article is for informational purposes only and not financial advice. Always conduct your own research before investing in cryptocurrencies.

0

Disclaimer: The content of this article solely reflects the author's opinion and does not represent the platform in any capacity. This article is not intended to serve as a reference for making investment decisions.

PoolX: Earn new token airdrops
Lock your assets and earn 10%+ APR
Lock now!

You may also like

New spot margin trading pair — HOLO/USDT!

Bitget Announcement2025/09/12 07:46

FUN drops by 32.34% within 24 hours as it faces a steep short-term downturn

- FUN plunged 32.34% in 24 hours to $0.008938, marking a 541.8% monthly loss amid prolonged bearish trends. - Technical breakdowns, elevated selling pressure, and forced liquidations highlight deteriorating market sentiment and risk-off behavior. - Analysts identify key support below $0.0080 as critical, with bearish momentum confirmed by RSI (<30) and MACD indicators. - A trend-following backtest strategy proposes short positions based on technical signals to capitalize on extended downward trajectories.

Bitget-RWA2025/09/12 06:14
FUN drops by 32.34% within 24 hours as it faces a steep short-term downturn

OPEN has dropped by 189.51% within 24 hours during a significant market pullback

- OPEN's price plummeted 189.51% in 24 hours to $0.8907, marking its largest intraday decline in history. - The token fell 3793.63% over 7 days, matching identical monthly and yearly declines, signaling severe bearish momentum. - Technical analysts cite broken support levels and lack of bullish catalysts as key drivers of the sustained sell-off. - Absence of stabilizing volume or reversal patterns leaves the market vulnerable to further downward pressure.

Bitget-RWA2025/09/12 06:14
OPEN has dropped by 189.51% within 24 hours during a significant market pullback

New spot margin trading pair — LINEA/USDT!

Bitget Announcement2025/09/11 10:04