

Date: Fri, March 14, 2025 | 09:10 AM GMT
The cryptocurrency market is showing signs of stabilization after a prolonged downtrend that began following the late 2024 rallies. Sonic (S) has emerged as a standout performer in this potential rebound, surging 16% after bouncing from a critical support level.
The price action suggests that a bullish reversal could be underway, helping Sonic (S) recover from its 34% decline over the past 90 days.
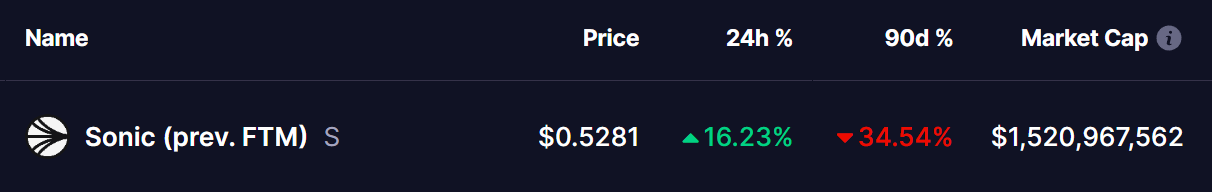 Source: Coinmarketcap
Double Bottom Pattern: A Strong Reversal Signal?
The daily chart of Sonic (S) reveals a double bottom pattern, a well-known bullish reversal structure that often signals the end of a downtrend and the start of a new upward trend. This formation occurs when the price tests a key support level twice, failing to break lower, and then begins moving higher—a strong indication that sellers are losing control.
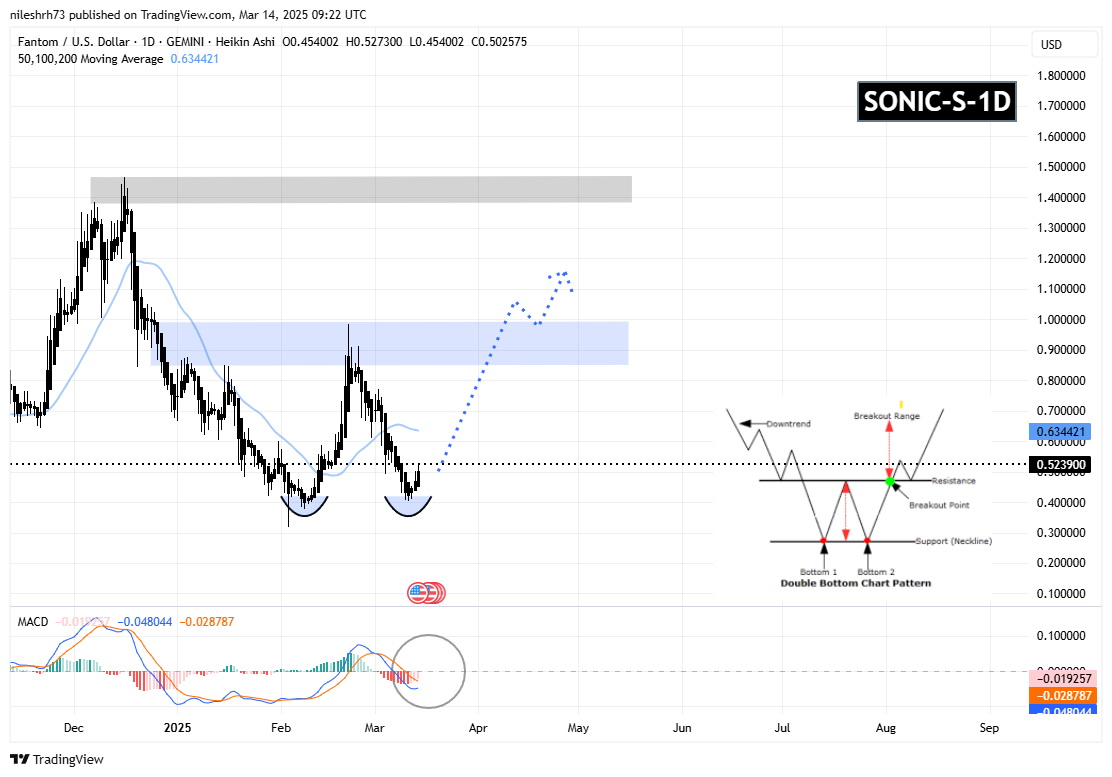 Sonic (S) Daily Chart/Coinsprobe (Source: Tradingview)
Recently, Sonic (S) faced rejection at its neckline resistance of $0.98, leading to a pullback toward the $0.40 support zone, which marked the second bottom of the pattern. However, this level held firm, and the price has now rebounded to $0.52, suggesting that buyers are stepping back in.
Adding to this bullish outlook, the MACD (Moving Average Convergence Divergence) indicator is displaying early signs of a bullish crossover, which historically signals a shift in momentum in favor of the buyers. If this pattern plays out as expected, Sonic (S) could attempt to reclaim the $0.98 neckline resistance in the near term. A successful breakout above this level could trigger a strong upward rally toward the next major resistance zone at $1.38–$1.46, representing an impressive potential gain of 178% from the current price.
Will This Pattern Confirm a Full Recovery?
With Sonic (S) rebounding strongly from a key support level, the double bottom pattern is gaining momentum. However, for this structure to confirm a full trend reversal, the price must decisively break above the $0.98 neckline resistance with strong volume support.
Disclaimer: This article is for informational purposes only and does not constitute financial advice. Always conduct your own research before making any investment decisions in cryptocurrencies.