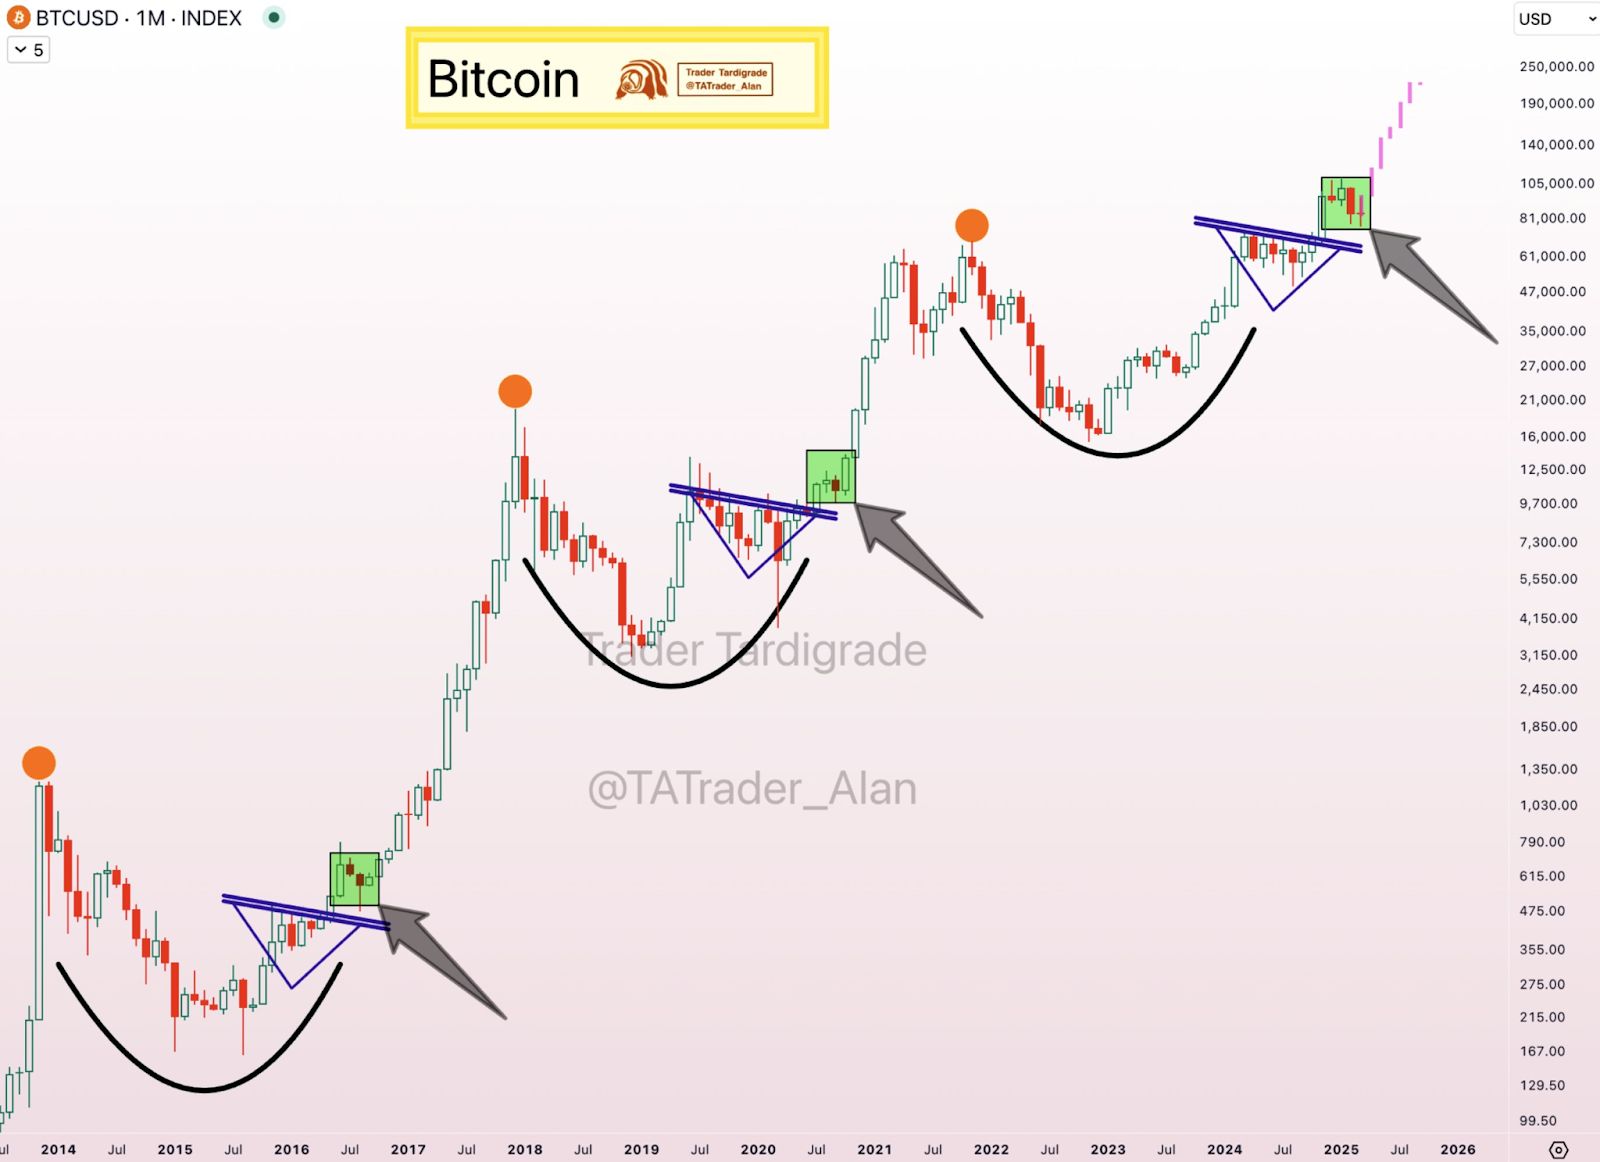
- Bitcoin exhibits recurring bull cycles characterized by rounded bottoms, triangle consolidation, and breakout confirmation candles that consistently trigger parabolic price surges recently.
- Triangle patterns indicate consolidation phases following downtrends, where confirmed breakout candles signal bullish momentum that has been repeated across multiple market cycles.
- Current market projections suggest Bitcoin’s early bull run phase mirrors historical trends, with price movements advancing toward six-figure valuations as cycles continue.
Bitcoin’s price action appears to follow a consistent historical pattern. Recent analysis reveals recurring cycles, triangle consolidations, and breakout signals that may forecast the next major bull run. This study examines repetitive market formations and potential targets for Bitcoin as it approaches new price levels.
Repetitive Market Cycles
Analysis from Trader Tardigrade outlines three major bull cycles in Bitcoin’s history. Each cycle presents a rounded bottom formation followed by a triangle consolidation phase. The tweet notes that a breakout confirmation candle leads to a parabolic price surge. Historical patterns show a consistent process of accumulation, breakout, and exponential growth before the next correction phase.
 Source : X/Trader Tardigrade
The market has experienced clear patterns over time. Observers have recorded rounded bottoms, triangle formations, and confirmed breakout candles. The tweet provides examples using black curves for rounded bottoms, blue lines for triangle patterns, and green boxes for breakout confirmation. This methodical cycle has been noted in previous bull runs.
Triangle Consolidation and Breakout
Bitcoin’s price consolidation in triangle patterns has drawn significant attention. Market analysts note that after a downtrend, Bitcoin enters a period of consolidation inside symmetrical triangles. This structure often sets the stage for strong bullish moves. The tweet underlines that once Bitcoin breaks out of these triangles, a bullish rally typically follows.
The tweet further explains that the breakout candle appears within a green box. The formation signals the commencement of a parabolic run. Market participants have observed these signals over successive cycles. They note that sustaining levels above the breakout point is critical for continued upward movement.
2024-2025 Market Projection
The current chart indicates Bitcoin may be in the early stages of its next bull run. The tweet suggests that after breaking out of the triangle, Bitcoin is consolidating in a bullish zone. A projected dotted pink line hints at potential movement toward $200,000-$250,000. Historical trends offer a reference point for these projections.
Market observers remain cautious of potential pullbacks if key levels between $60K and $80K are not sustained. They acknowledge that macroeconomic factors and regulatory conditions could affect price stability. The analysis remains neutral while detailing a clear process seen in previous cycles. Investors continue to monitor these signals as Bitcoin potentially embarks on its next significant price advance.
At press time, Bitcoin holds a market value of $82,663.67 , and its daily trading activity reaches $13,425,771,535. Within the last 24 hours, Bitcoin has lost -1.71% of its value, while the currency fell by -2.73% throughout the previous week.
DISCLAIMER: The information on this website is provided as general market commentary and does not constitute investment advice. We encourage you to do your own research before investing.


