Date: Wed, March 19, 2025 | 09:38 AM GMT
The crypto market is showing early signs of a rebound as Ethereum (ETH) has bounced back from last week’s low of $1,774 and is now trading above $2,000—a promising shift after a choppy start to March. As sentiment gradually improves, altcoins like Kadena (KDA) are beginning to stir as well.
KDA has taken a heavy hit over the past few months, but with impressive weekly gains and ongoing price action suggests that a recovery may be underway.
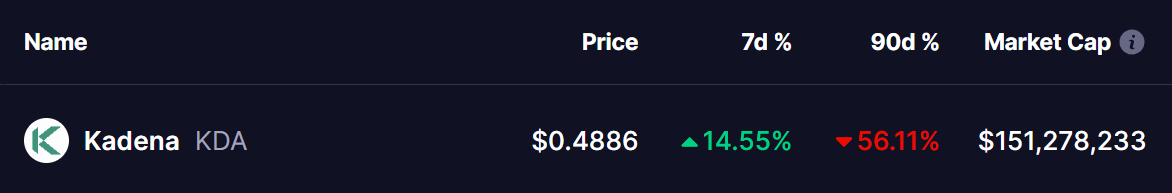 Source: Coinmarketcap
Double Bottom Pattern Hints at Recovery
On the weekly chart, KDA has formed a classic double-bottom pattern after experiencing a sharp downtrend that started when it failed to break the $1.98 neckline resistance in early December 2024. Since then, KDA has revisited the $0.36 support level, marking the second bottom of the pattern.
With this pattern forming, KDA has held this support and has now bounced to $0.49, indicating a potential shift in trend. The MACD indicator for KDA is also hinting at a possible bullish crossover, suggesting that momentum could continue to build.
If this recovery gains further strength, the next key resistance level is the 25-day moving average (MA). A decisive move above this level would confirm the uptrend and could pave the way for an attempt to reclaim the $1.98 neckline resistance in the near term.
Final Thoughts
While the broader market remains volatile, KDA’s technical setup looks promising for a potential bullish breakout. However, a failure to hold $0.36 support could invalidate the double-bottom formation, leading to further downside. Traders should watch for a decisive move above key resistance levels to confirm the trend reversal.
Disclaimer: This article is for informational purposes only and does not constitute financial advice. Always conduct your own research before investing in cryptocurrencies.