SHIB’s Downward Pressure Grows: A Breakdown Below Support


- SHIB is testing key support at 0.00001079 USD with a high potential of a breakdown.
- Fibonacci levels indicate potential further downside for SHIB if support fails.
- MACD and RSI indicators suggest bearish momentum is in control of Shiba Inu’s price.
Shiba Inu has shown signs of weakness on the 7-day chart, indicating the possibility of a price dip in the upcoming weeks. Currently priced at 0.00001489 USD, SHIB is trading within a narrowing channel, which suggests a high chance of a breakdown. The token now tests a supportive zone at the 0.00001079 USD mark, a price it has held fast within the last months. Should this level be breached, SHIB could come under further pressure to the downside, making the bearish outlook in the market permanent.
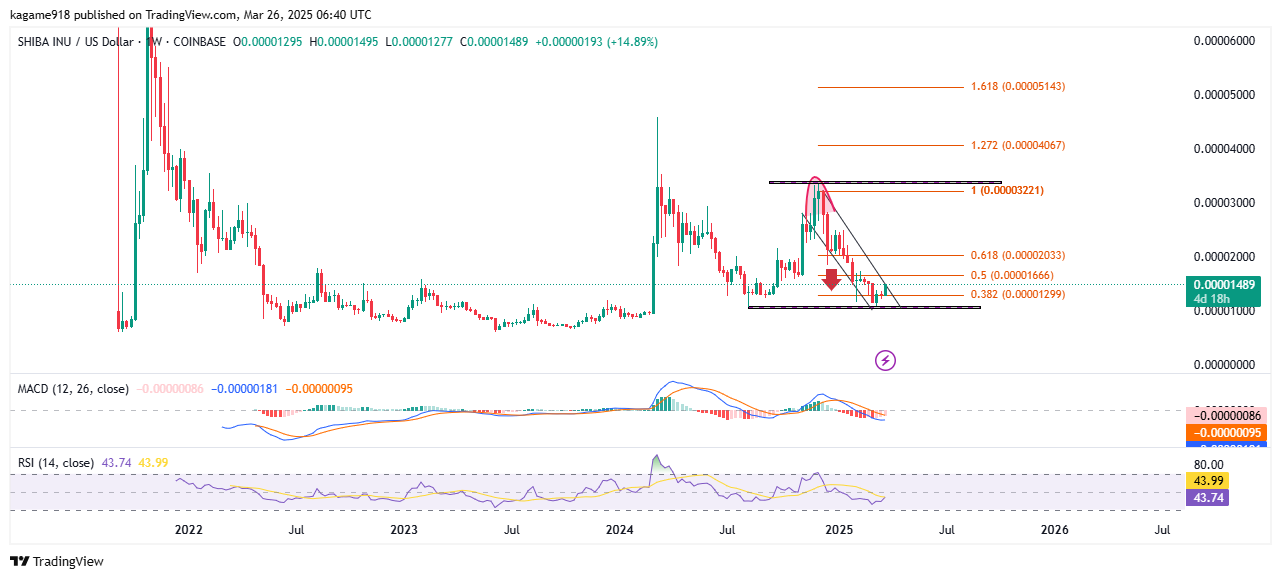
Source: Tradingview
Support and Resistance Levels in Focus
The current support level for SHIB is 0.00001079 USD, often referred to as a key level for traders that has seen consistent testing through recent price action. However, with price action narrowing on the chart, SHIB may see a break beneath this support, with further decline of the token’s value.
On the resistance side, SHIB has been encountering strong resistance at 0.00003221 USD, marked by the Fibonacci retracement level of 1.0. This is a critical zone for SHIB, as any further rally will likely face resistance at this point. The token has made several attempts to break past this resistance but has failed to sustain upward momentum. This price range will be watched closely by market participants, as a breakout above 0.00003221 USD could signal a reversal in the current trend.
Related: Shiba Inu’s Technical Levels Show Room for a Bullish Move
Fibonacci Analysis: Potential for Further Downside
A further survey of SHIB’s price through Fibonacci retracement levels has revealed that the token has currently settled down at the 0.382 level located at 0.00001299 USD. This is a high level at which the breach below could indicate further downside. The Fibonacci tool also delineates a concern of a number of points above the price of 0.5 retracements of 0.00001666 USD and 0.618 in 0.00002033 USD, and may offer possible resistance should SHIB manage to retrace its steps.
However, the present price action with directions in the triangle formation should indicate SHIB in the future facing a collapse. The MACD indicator further assures this possibility, as it remains in bearish territory with a negative histogram, suggesting that selling momentum is still in play. The RSI, hovering around 43.74, is also signaling neutral conditions, but its inability to break into the overbought territory could indicate a lack of strong buying pressure.
The post SHIB’s Downward Pressure Grows: A Breakdown Below Support appeared first on Cryptotale.
Disclaimer: The content of this article solely reflects the author's opinion and does not represent the platform in any capacity. This article is not intended to serve as a reference for making investment decisions.
You may also like
Institutions Develop Blockchain Foundations, Signaling the Advancement of the Crypto Industry
- Institutional crypto adoption accelerates as venture funding, ETFs, and strategic acquisitions drive market maturation, per Cosmos Labs CEO Magnus Mareneck. - Coinbase's $375M Echo acquisition and BlackRock's $137.5M Ethereum/Bitcoin ETF inflows highlight infrastructure-building over speculation. - Cosmos emphasizes interoperability to support DeFi and tokenization, with partnerships enabling programmable banking and real-time settlements. - Mareneck warns of valuation risks (e.g., SEALSQ's 10.1x P/B rat

Solana News Update: Solana ETF Climbs While Token Declines: Institutional Demand Contrasts with Retail Outlook
- Bitwise's Solana Staking ETF (BSOL) raised $222.8M in assets on its 2025 debut, outpacing most new ETFs with $56M in first-day trading volume. - The fund offers direct Solana exposure with staking rewards, attracting institutional interest through a novel structure distinct from traditional spot ETFs. - SEC guidance on PoS and liquid staking enabled BSOL's launch, with Bitwise leveraging its European staking product experience to enter the U.S. market. - Despite BSOL's success, Solana's token price fell

Bitcoin Updates: The Crypto Market’s Psychological Maze Encounters AI’s Strategic Pathway Out
- Token Metrics AI Indices combat crypto volatility by using analytics to address psychological biases like FOMO and panic selling. - Bitcoin near $115,000 faces 2025-2026 price forecasts up to $500,000, driven by Fed rate cuts and U.S.-China cooperation boosting liquidity. - AI tools project $177,000–$427,000 BTC ranges based on market cap scenarios, while prioritizing risk mitigation through diversification and real-time monitoring. - Dynamic AI strategies balance growth and downside protection, using me

OceanPal’s Shift to AI and Blockchain Triggers 22.5% Drop in Share Price
- OceanPal Inc. pivoted to AI via a $120M investment in NEAR Protocol, launching SovereignAI to commercialize blockchain-based AI infrastructure. - The strategy targets 10% NEAR token ownership and leverages NVIDIA tech for confidential AI-cloud solutions, aligning with institutional interest in privacy-focused AI. - Despite continued shipping operations, OceanPal reported a $10.4M net loss and saw its stock drop 22.5% post-announcement, reflecting market skepticism about the strategic shift. - Backed by c