Bitget App
Trade smarter
Buy cryptoMarketsTradeFuturesEarnWeb3SquareMore
Trade
Spot
Buy and sell crypto with ease
Margin
Amplify your capital and maximize fund efficiency
Onchain
Going Onchain, without going Onchain!
Convert & block trade
Convert crypto with one click and zero fees
Explore
Launchhub
Gain the edge early and start winning
Copy
Copy elite trader with one click
Bots
Simple, fast, and reliable AI trading bot
Trade
USDT-M Futures
Futures settled in USDT
USDC-M Futures
Futures settled in USDC
Coin-M Futures
Futures settled in cryptocurrencies
Explore
Futures guide
A beginner-to-advanced journey in futures trading
Futures promotions
Generous rewards await
Overview
A variety of products to grow your assets
Simple Earn
Deposit and withdraw anytime to earn flexible returns with zero risk
On-chain Earn
Earn profits daily without risking principal
Structured Earn
Robust financial innovation to navigate market swings
VIP and Wealth Management
Premium services for smart wealth management
Loans
Flexible borrowing with high fund security
XRP at Symmetrical Triangle Support – Breakdown or Bounce? Analyst Insights

XRP at Symmetrical Triangle Support – Breakdown or Bounce? Analyst Insights

CoinsProbeCoinsProbe2025/03/30 08:33
By:Nilesh Hembade

Date: Sat, March 29, 2025 | 05:10 PM GMT

The cryptocurrency market has quickly taken a U-turn from its weekly recovery, as Ethereum (ETH) has declined by over 8.50% in the last 48 hours, dipping to the $1,850 mark from the $2,000 level. This downturn has added selling pressure across major altcoins as well.

Amid this downturn, XRP has also faced a decline, dropping over 3% today and extending its weekly decline to over 11%. The price action is now at a crucial juncture, where traders are closely monitoring whether it will break down from the symmetrical triangle or bounce back from support.

XRP at Symmetrical Triangle Support – Breakdown or Bounce? Analyst Insights image 0 
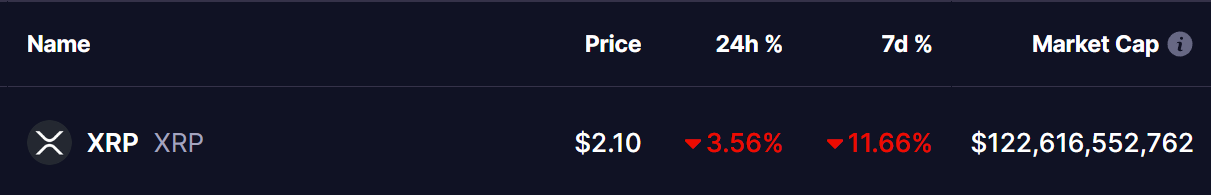
Source: Coinmarketcap

Symmetrical Triangle Breakdown or Bounce?

According to the latest analysis by crypto chart analyst @JohncyCrypto, Ripple (XRP) is forming a symmetrical triangle pattern on the daily timeframe. Currently trading at $2.11, the price is consolidating near a critical support zone, where a potential bounce is possible.

XRP at Symmetrical Triangle Support – Breakdown or Bounce? Analyst Insights image 1 
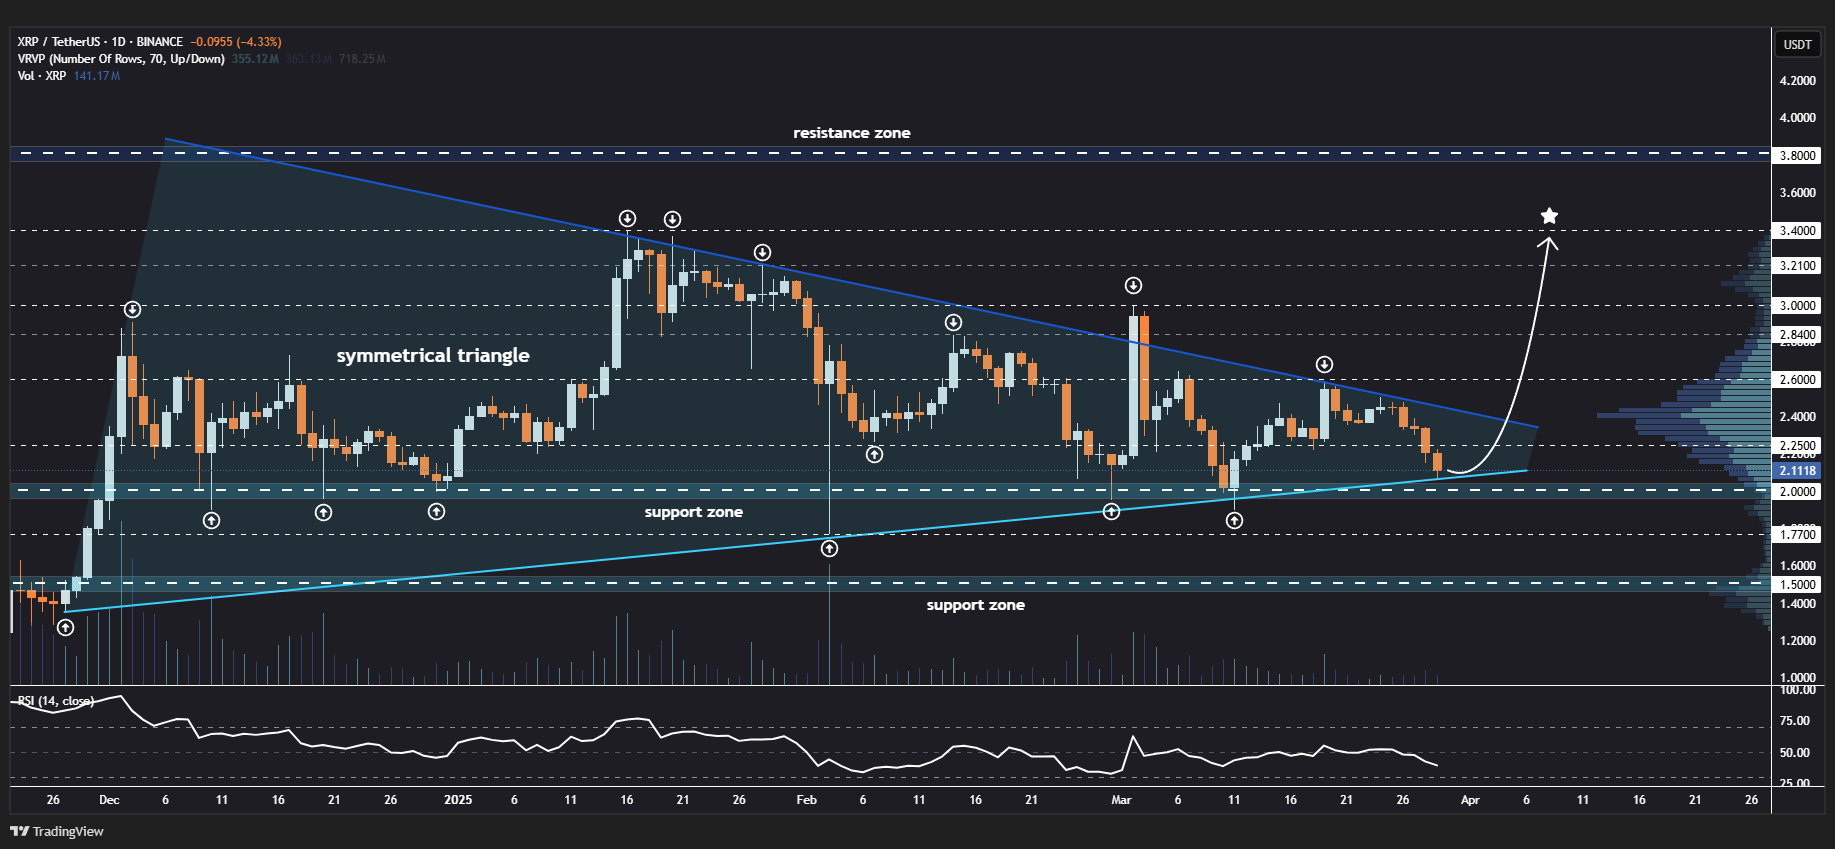
XRP Daily Chart/Source: @JohncyCrypto (X)

If buyers step in and the price manages to break above the descending resistance, we could see an upward move toward the key targets at $2.60, $2.84, $3.00, $3.21, and ultimately $3.40.

However, a failure to hold the support level near $2.00 could lead to further downside, potentially dragging the price to lower levels of interest around $1.77 or even $1.50. The RSI indicator is showing signs of oversold conditions, which may hint at a possible reversal if buying momentum increases in the coming sessions.

What to Expect Ahead?

Traders and investors should keep a close eye on the breakout direction from this symmetrical triangle. A decisive move above the resistance trendline with strong volume confirmation could signal the start of a new bullish phase for XRP. On the other hand, if the support fails to hold, a deeper correction could be in play.

Market sentiment and broader crypto trends will also play a crucial role in determining XRP’s next move. With Ethereum and Bitcoin struggling at key support levels, XRP’s price action might remain volatile in the short term.

Disclaimer: This article is for informational purposes only and not financial advice. Always conduct your own research before investing in cryptocurrencies

0

Disclaimer: The content of this article solely reflects the author's opinion and does not represent the platform in any capacity. This article is not intended to serve as a reference for making investment decisions.

PoolX: Earn new token airdrops
Lock your assets and earn 10%+ APR
Lock now!

You may also like

New spot margin trading pair — HOLO/USDT!

Bitget Announcement2025/09/12 07:46

FUN drops by 32.34% within 24 hours as it faces a steep short-term downturn

- FUN plunged 32.34% in 24 hours to $0.008938, marking a 541.8% monthly loss amid prolonged bearish trends. - Technical breakdowns, elevated selling pressure, and forced liquidations highlight deteriorating market sentiment and risk-off behavior. - Analysts identify key support below $0.0080 as critical, with bearish momentum confirmed by RSI (<30) and MACD indicators. - A trend-following backtest strategy proposes short positions based on technical signals to capitalize on extended downward trajectories.

Bitget-RWA2025/09/12 06:14
FUN drops by 32.34% within 24 hours as it faces a steep short-term downturn

OPEN has dropped by 189.51% within 24 hours during a significant market pullback

- OPEN's price plummeted 189.51% in 24 hours to $0.8907, marking its largest intraday decline in history. - The token fell 3793.63% over 7 days, matching identical monthly and yearly declines, signaling severe bearish momentum. - Technical analysts cite broken support levels and lack of bullish catalysts as key drivers of the sustained sell-off. - Absence of stabilizing volume or reversal patterns leaves the market vulnerable to further downward pressure.

Bitget-RWA2025/09/12 06:14
OPEN has dropped by 189.51% within 24 hours during a significant market pullback

New spot margin trading pair — LINEA/USDT!

Bitget Announcement2025/09/11 10:04