
Bitcoin’s Bullish Pattern Might Be a Trap, Warns Veteran Trader

A widely recognized bullish formation in Bitcoin’s price charts might not be as promising as it appears, warns veteran trader Peter Brandt. The cryptocurrency has developed an inverse head-and-shoulders pattern, typically seen as a sign of a potential upward reversal. However, the structure presents a complication—the neckline is sloping downward.
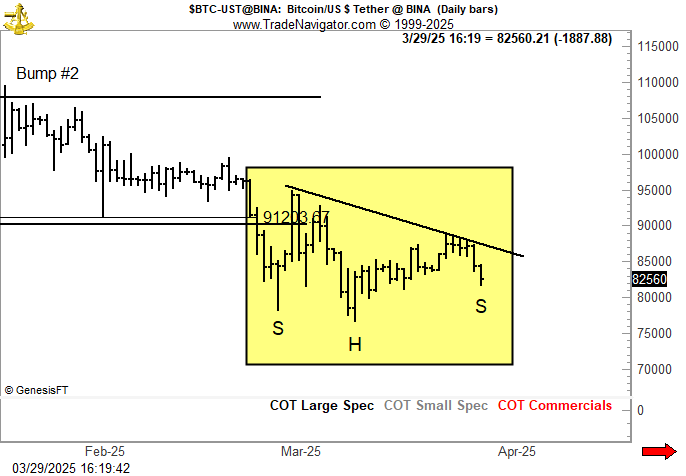
Brandt, who has spent over 40 years in commodities trading, favors head-and-shoulders formations with horizontal necklines, considering them far more dependable.
The downward angle of Bitcoin’s current setup suggests weakening buying pressure, raising the possibility that any breakout attempt could be short-lived, sending the price tumbling instead of rallying.
READ MORE:
Bitcoin Could Hit $150,000 by Year-End, Says Financial ExpertTrader Josh Olszewicz also pointed out the pattern on Bitcoin’s daily chart, suggesting that this may be a crucial moment for bulls to regain control. Should they fail to push the price higher, Bitcoin could slip back into the $60,000-$70,000 range.
As of now, CoinGecko data shows Bitcoin trading at $83,091, down 0.7% in the past day. The asset briefly hit an intraday low of $81,769 earlier on Sunday, struggling to regain momentum amid heightened global economic uncertainty.
Disclaimer: The content of this article solely reflects the author's opinion and does not represent the platform in any capacity. This article is not intended to serve as a reference for making investment decisions.
You may also like
New spot margin trading pair — HOLO/USDT!
FUN drops by 32.34% within 24 hours as it faces a steep short-term downturn
- FUN plunged 32.34% in 24 hours to $0.008938, marking a 541.8% monthly loss amid prolonged bearish trends. - Technical breakdowns, elevated selling pressure, and forced liquidations highlight deteriorating market sentiment and risk-off behavior. - Analysts identify key support below $0.0080 as critical, with bearish momentum confirmed by RSI (<30) and MACD indicators. - A trend-following backtest strategy proposes short positions based on technical signals to capitalize on extended downward trajectories.

OPEN has dropped by 189.51% within 24 hours during a significant market pullback
- OPEN's price plummeted 189.51% in 24 hours to $0.8907, marking its largest intraday decline in history. - The token fell 3793.63% over 7 days, matching identical monthly and yearly declines, signaling severe bearish momentum. - Technical analysts cite broken support levels and lack of bullish catalysts as key drivers of the sustained sell-off. - Absence of stabilizing volume or reversal patterns leaves the market vulnerable to further downward pressure.

New spot margin trading pair — LINEA/USDT!