
Solana (SOL) Risks Dropping Below $110 as Bears Take Control

Solana trades below $150 with bearish technicals intensifying. With support near $120, SOL risks dipping under $110 if momentum fails to shift.
Solana (SOL) has dropped over 6% in the past seven days and has been trading below $150 since March 6. The current trend shows clear bearish signals across multiple indicators.
From a death cross to a rising ADX and a red Ichimoku Cloud, technicals suggest growing downside pressure. With SOL nearing key support, the next few days could be critical for its price direction.
SOL Ichimoku Cloud Paints A Bearish Picture
The Ichimoku Cloud chart for Solana shows a clear bearish structure, with price action trading below both the Kijun-sen (red line) and Tenkan-sen (blue line).
The Lagging Span (green line) is also positioned below the price candles and the cloud, reinforcing the negative outlook. The Kumo ahead is red and descending, suggesting that resistance remains strong in the near term.
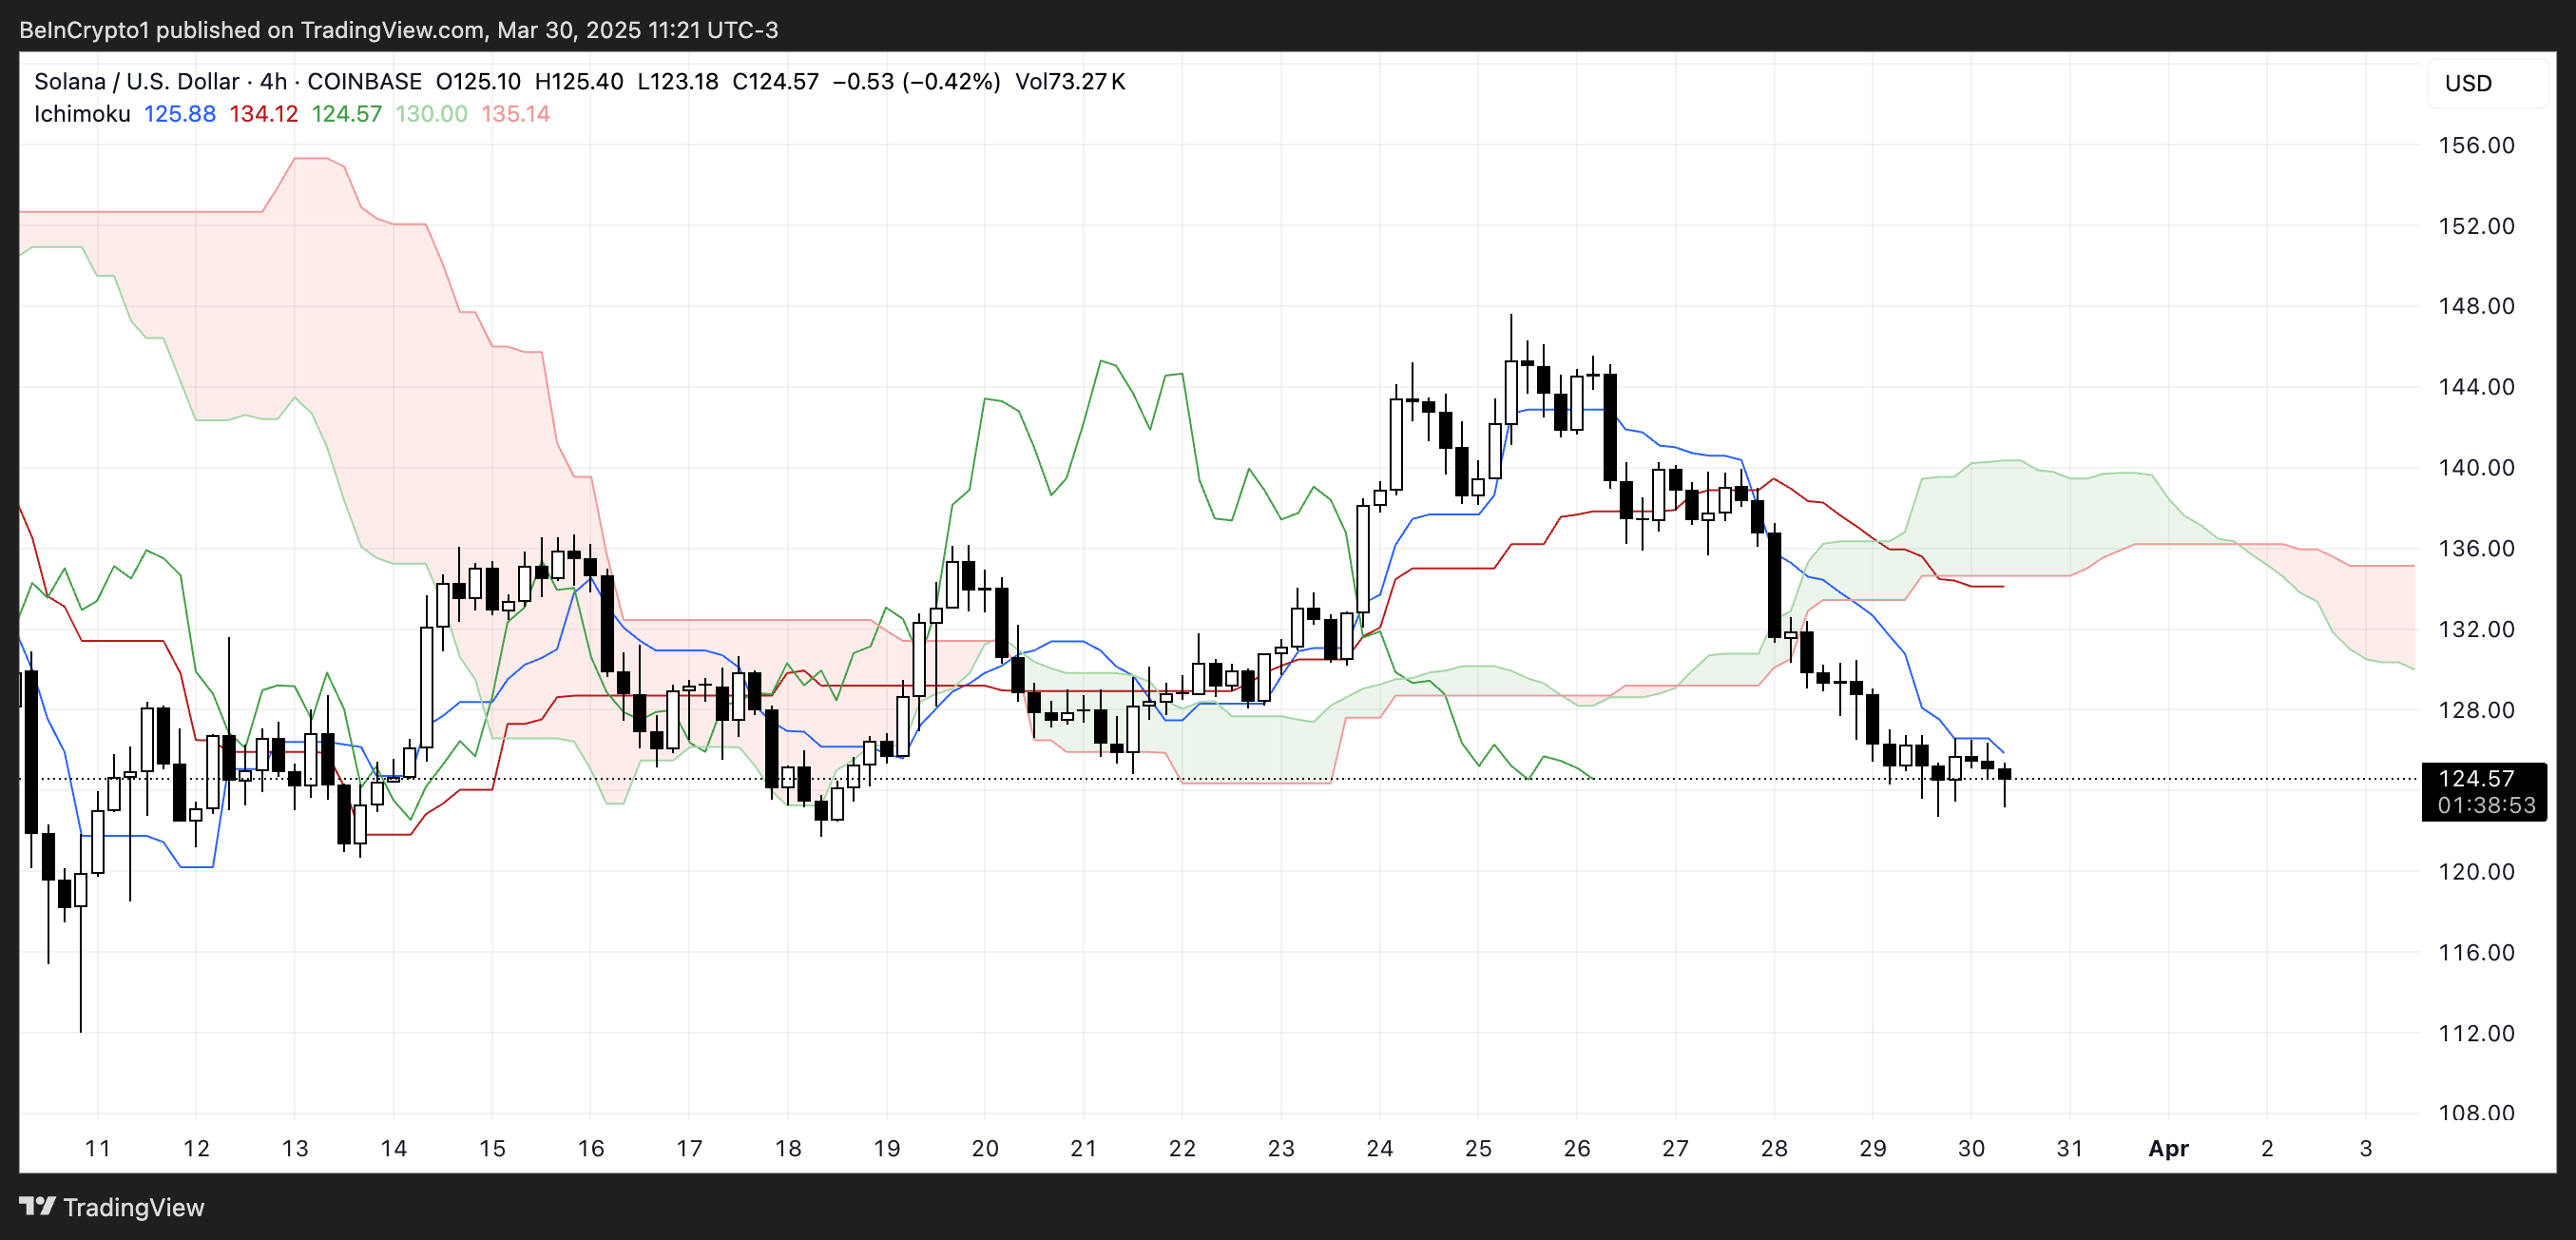 SOL Ichimoku Cloud. Source:
TradingView.
SOL Ichimoku Cloud. Source:
TradingView.
Solana has struggled to break above short-term resistance levels and remains stuck in a downward channel. The thin nature of the current cloud suggests weak support, making the price vulnerable to further downside if bearish momentum continues.
For a reversal, Solana would need to break above the Kijun-sen and push decisively toward the cloud, but for now, the trend remains tilted to the downside.
Solana DMI Shows Sellers Are In Control
Solana’s DMI chart shows a sharp rise in the ADX, now at 40.87—up from 19.74 just three days ago.
The ADX (Average Directional Index) measures the strength of a trend, with values above 25 indicating a strong trend and values above 40 signaling a very strong one.
This surge confirms that the current downtrend in SOL is gaining momentum.
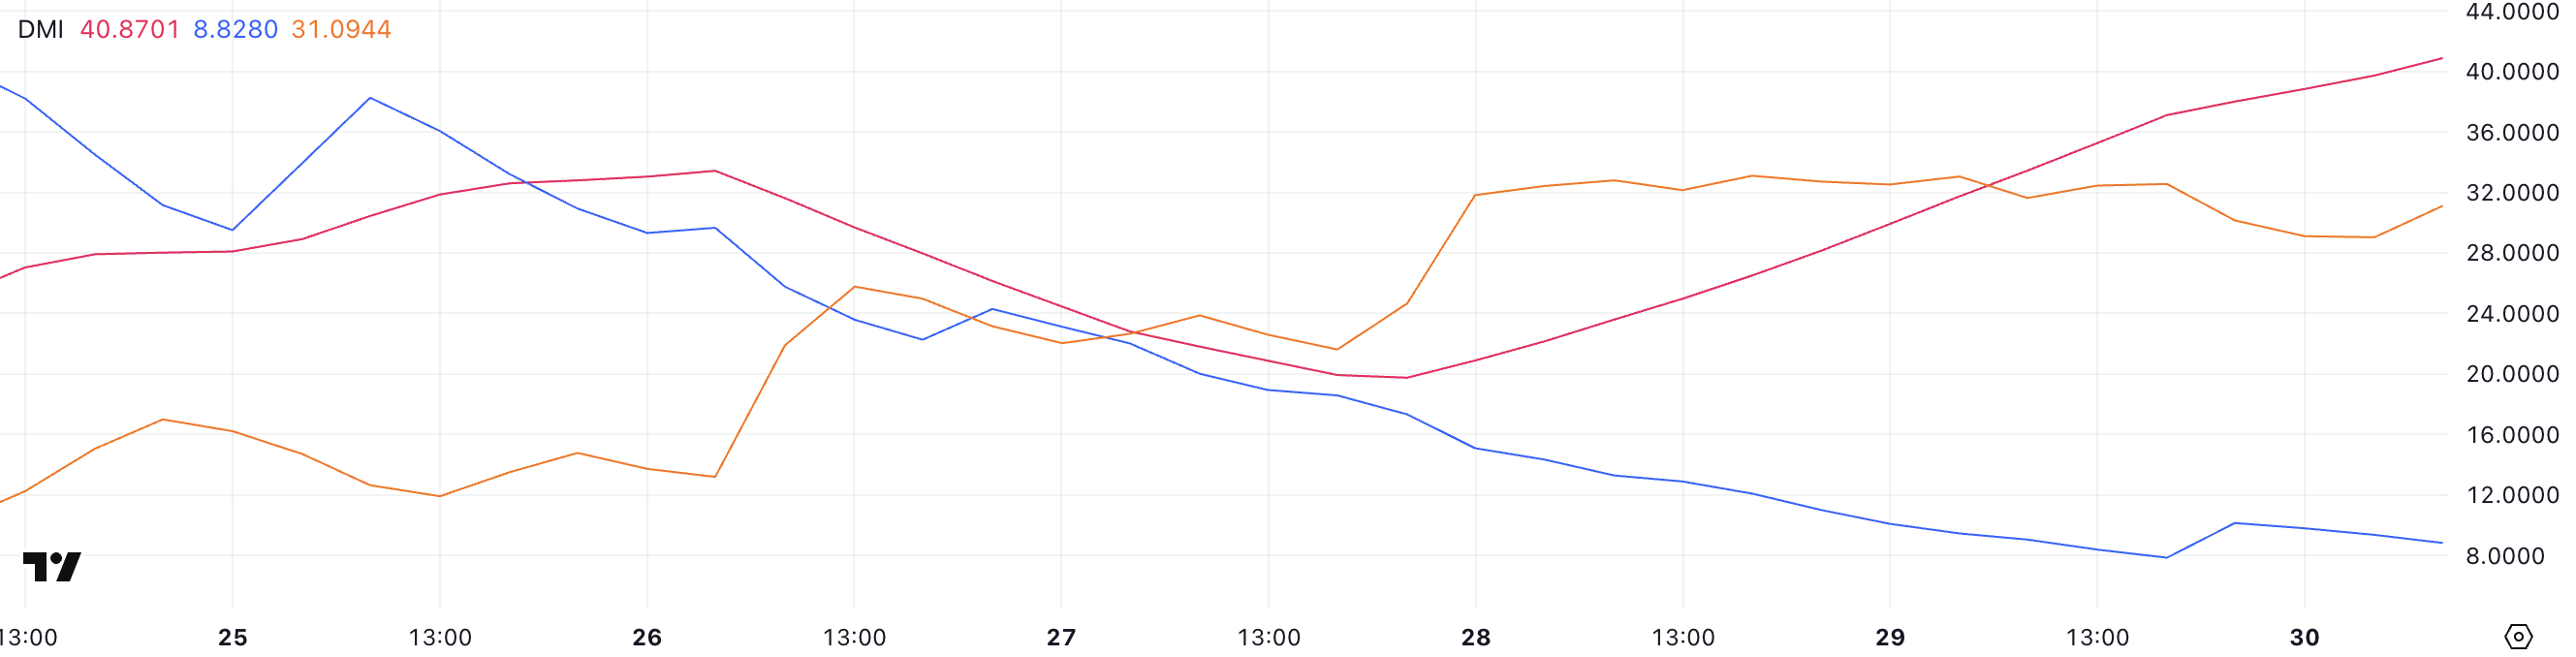 SOL DMI. Source:
TradingView.
SOL DMI. Source:
TradingView.
At the same time, the +DI has dropped from 17.32 to 8.82, while the -DI has climbed to 31.09, where it has held steady for the past two days.
This setup suggests that the sellers are firmly in control, and the downtrend is strong and also strengthening.
As long as the -DI remains dominant and ADX stays elevated, SOL is likely to remain under pressure in the short term.
Can Solana Drop Below $110 Soon?
Solana recently formed a death cross, a bearish signal where short-term moving averages cross below long-term ones.
It’s now approaching key support at $120—if that level breaks, Solana price could drop to $112, and possibly below $110 for the first time since February 2024.
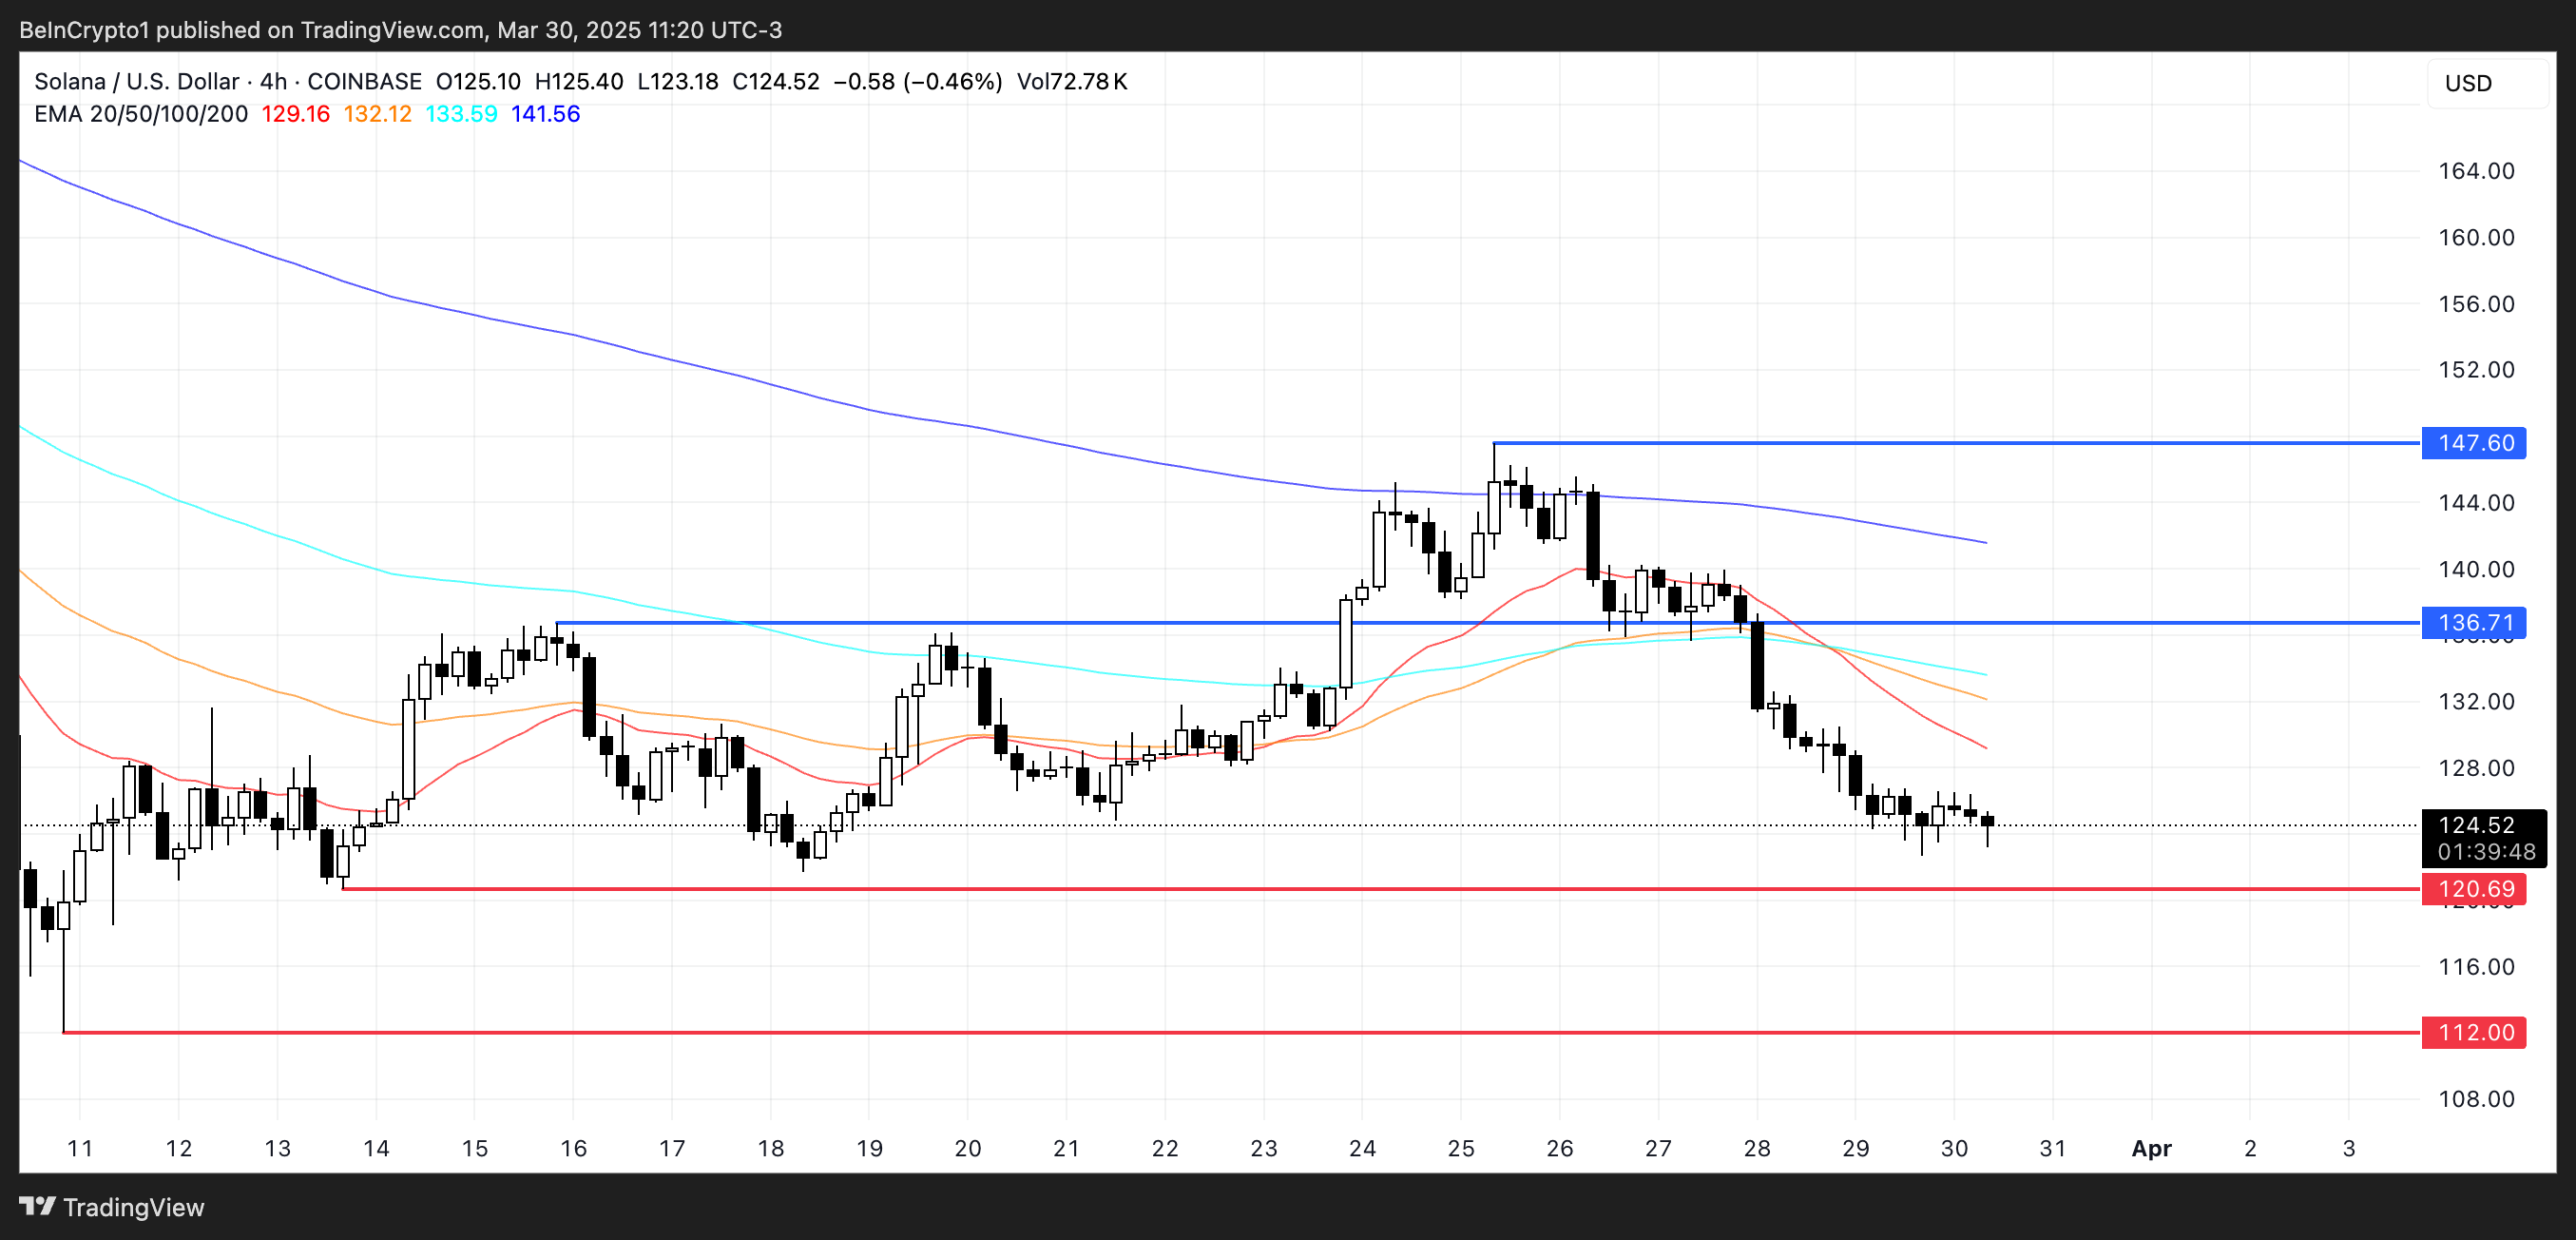 SOL Price Analysis. Source:
TradingView.
SOL Price Analysis. Source:
TradingView.
If bulls step in and buying pressure returns, SOL could rebound toward resistance at $136.
A breakout above that level may lead to a push toward $147, which acted as strong resistance just five days ago.
Disclaimer: The content of this article solely reflects the author's opinion and does not represent the platform in any capacity. This article is not intended to serve as a reference for making investment decisions.
You may also like
New spot margin trading pair — HOLO/USDT!
FUN drops by 32.34% within 24 hours as it faces a steep short-term downturn
- FUN plunged 32.34% in 24 hours to $0.008938, marking a 541.8% monthly loss amid prolonged bearish trends. - Technical breakdowns, elevated selling pressure, and forced liquidations highlight deteriorating market sentiment and risk-off behavior. - Analysts identify key support below $0.0080 as critical, with bearish momentum confirmed by RSI (<30) and MACD indicators. - A trend-following backtest strategy proposes short positions based on technical signals to capitalize on extended downward trajectories.

OPEN has dropped by 189.51% within 24 hours during a significant market pullback
- OPEN's price plummeted 189.51% in 24 hours to $0.8907, marking its largest intraday decline in history. - The token fell 3793.63% over 7 days, matching identical monthly and yearly declines, signaling severe bearish momentum. - Technical analysts cite broken support levels and lack of bullish catalysts as key drivers of the sustained sell-off. - Absence of stabilizing volume or reversal patterns leaves the market vulnerable to further downward pressure.

New spot margin trading pair — LINEA/USDT!