
Last updated: March 30, 2025 07:58 EDT
Bitget App
Trade smarter

Bitcoin Flashes Bullish Divergence: Are We Headed for a Trend Reversal?
By:Arslan Butt
Disclaimer: Crypto is a high-risk asset class. This article is provided for informational purposes and does not constitute investment advice. You could lose all of your capital.
 Bitcoin Price Prediction
Bitcoin (BTC) is showing early signs of a bullish reversal, but not everyone is convinced. A classic inverse head-and-shoulders (H&S) formation has emerged on the daily chart—typically a strong signal of upside potential. However, veteran chartist Peter Brandt is urging caution.
Brandt, a seasoned commodity trader with over four decades of experience, points to a downward-sloping neckline, which could undermine the reliability of the pattern.
“I prefer H&S patterns with horizontal necklines,” he noted, adding that sloped necklines often suggest weakened buying pressure and a higher likelihood of false breakouts.
This aligns with the broader market narrative: while Bitcoin is attempting to find its footing, momentum remains fragile amid macro uncertainty and mixed technical signals.
Bitcoin Price Analysis – March 30, 2025
As of writing, Bitcoin trades at $83,098, recovering slightly from a session low of $82,978. The price remains compressed within a broad symmetrical triangle, reflecting the market’s indecision heading into month-end.
The key pivot level at $83,662—which has acted as both support and resistance in recent sessions—remains under pressure but hasn’t yet been reclaimed. A strong close above this level would signal a potential shift in momentum.
Bullish Divergence in Focus
On the 2-hour timeframe, the Relative Strength Index (RSI) presents a bullish divergence: price made a lower low, while RSI made a higher low, now reading 41.94.
This often hints at waning bearish momentum and sets the stage for a short-term bounce—if bulls can break above resistance.

The immediate hurdle lies at the 50-period EMA ($84,538). A clean break above it could pave the way toward:
- $85,551 – short-term breakout target
- $86,927 – triangle resistance and potential upside cap
Conversely, failure to hold $81,278 support would invalidate the bullish setup, exposing BTC to further downside toward $79,990 or even $78,319.
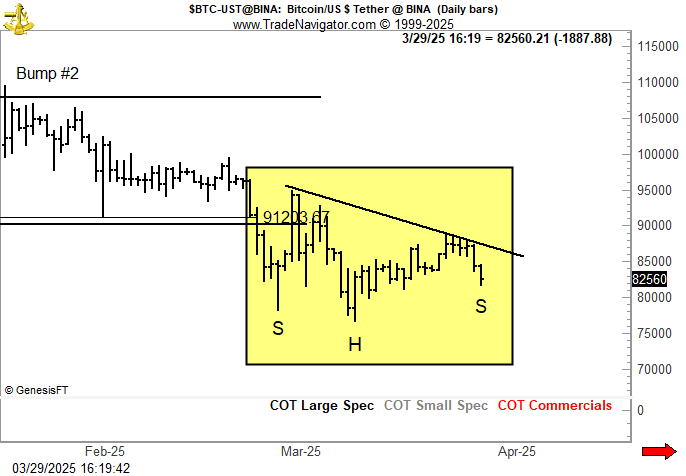
Chart Overview: Inverse H&S with a Twist
Brandt’s caution is visually evident. The inverse H&S pattern forming since early March features a clearly sloped neckline, diverging from traditional bullish structures. As shown in the highlighted yellow zone:
- Left Shoulder (S) formed mid-March
- Head (H) bottomed on March 20
- Right Shoulder (S) is developing with lower highs
- Neckline resistance coincides with ~$91,200, trending downward
This structure may still break to the upside—but traders should watch for a volume-supported breakout to validate any move.
Conclusion
Bitcoin is showing early signs of a bullish reversal, supported by RSI divergence and a potential inverse H&S formation. However, Peter Brandt’s warning about the sloping neckline shouldn’t be ignored—especially in a market lacking strong volume confirmation.
A break above $84,538, accompanied by rising volume, would strengthen the bullish case. Until then, traders should tread carefully. Fakeouts are common in this kind of setup, and the current macro environment only adds to the uncertainty.
BTC Bull: Earn Bitcoin Rewards with the Hottest Crypto Presale
BTC Bull ($BTCBULL) is making waves as a community-driven token that automatically rewards holders with real Bitcoin when BTC hits key price milestones. Unlike traditional meme tokens, BTCBULL is built for long-term investors, offering real incentives through airdropped BTC rewards and staking opportunities.
Staking & Passive Income Opportunities
BTC Bull offers a high-yield staking program with an impressive 119% APY, allowing users to generate passive income. The staking pool has already attracted 882.5 million BTCBULL tokens, highlighting strong community participation.
Latest Presale Updates:
- Current Presale Price: $0.002425 per BTCBULL
- Total Raised: $4M / $4.5M target
With demand surging, this presale provides an opportunity to acquire BTCBULL at early-stage pricing before the next price increase.
0
0
Disclaimer: The content of this article solely reflects the author's opinion and does not represent the platform in any capacity. This article is not intended to serve as a reference for making investment decisions.
PoolX: Earn new token airdrops
Lock your assets and earn 10%+ APR
Lock now!
You may also like
New spot margin trading pair — HOLO/USDT!
Bitget Announcement•2025/09/12 07:46
FUN drops by 32.34% within 24 hours as it faces a steep short-term downturn
- FUN plunged 32.34% in 24 hours to $0.008938, marking a 541.8% monthly loss amid prolonged bearish trends. - Technical breakdowns, elevated selling pressure, and forced liquidations highlight deteriorating market sentiment and risk-off behavior. - Analysts identify key support below $0.0080 as critical, with bearish momentum confirmed by RSI (<30) and MACD indicators. - A trend-following backtest strategy proposes short positions based on technical signals to capitalize on extended downward trajectories.
Bitget-RWA•2025/09/12 06:14

OPEN has dropped by 189.51% within 24 hours during a significant market pullback
- OPEN's price plummeted 189.51% in 24 hours to $0.8907, marking its largest intraday decline in history. - The token fell 3793.63% over 7 days, matching identical monthly and yearly declines, signaling severe bearish momentum. - Technical analysts cite broken support levels and lack of bullish catalysts as key drivers of the sustained sell-off. - Absence of stabilizing volume or reversal patterns leaves the market vulnerable to further downward pressure.
Bitget-RWA•2025/09/12 06:14

New spot margin trading pair — LINEA/USDT!
Bitget Announcement•2025/09/11 10:04
Trending news
MoreCrypto prices
MoreBitcoin
BTC
$116,319.54
+0.33%
Ethereum
ETH
$4,717.71
+4.18%
XRP
XRP
$3.11
+1.55%
Tether USDt
USDT
$1
+0.03%
Solana
SOL
$244.04
+4.52%
BNB
BNB
$927.43
+2.32%
USDC
USDC
$0.9999
+0.00%
Dogecoin
DOGE
$0.2804
+6.59%
TRON
TRX
$0.3526
+0.91%
Cardano
ADA
$0.9290
+2.57%
How to sell PI
Bitget lists PI – Buy or sell PI quickly on Bitget!
Trade now
Become a trader now?A welcome pack worth 6200 USDT for new users!
Sign up now