

- Ethereum trades below $1,810 as bearish momentum dominates market sentiment.
- Sustained exchange outflows signal defensive positioning by ETH investors.
- RSI and MACD reflect weak momentum, with no clear signs of reversal yet.
Ethereum’s price fell below the $1,810 mark recently as increasing bearish pressure emerged across the crypto market. Current technical and on-chain indicators reflect a cautious investor stance. Trading activity shows signs of declining, consistent spot outflows continue, and weak momentum metrics signal a possible continuation of the downward trend.
According to recent market data, Ethereum’s funding rates across major exchanges shifted into negative territory. This suggests many derivatives traders currently avoid high-risk leveraged long positions on ETH. Historical patterns observed between ETH funding rates and subsequent price action often show a strong correlation.
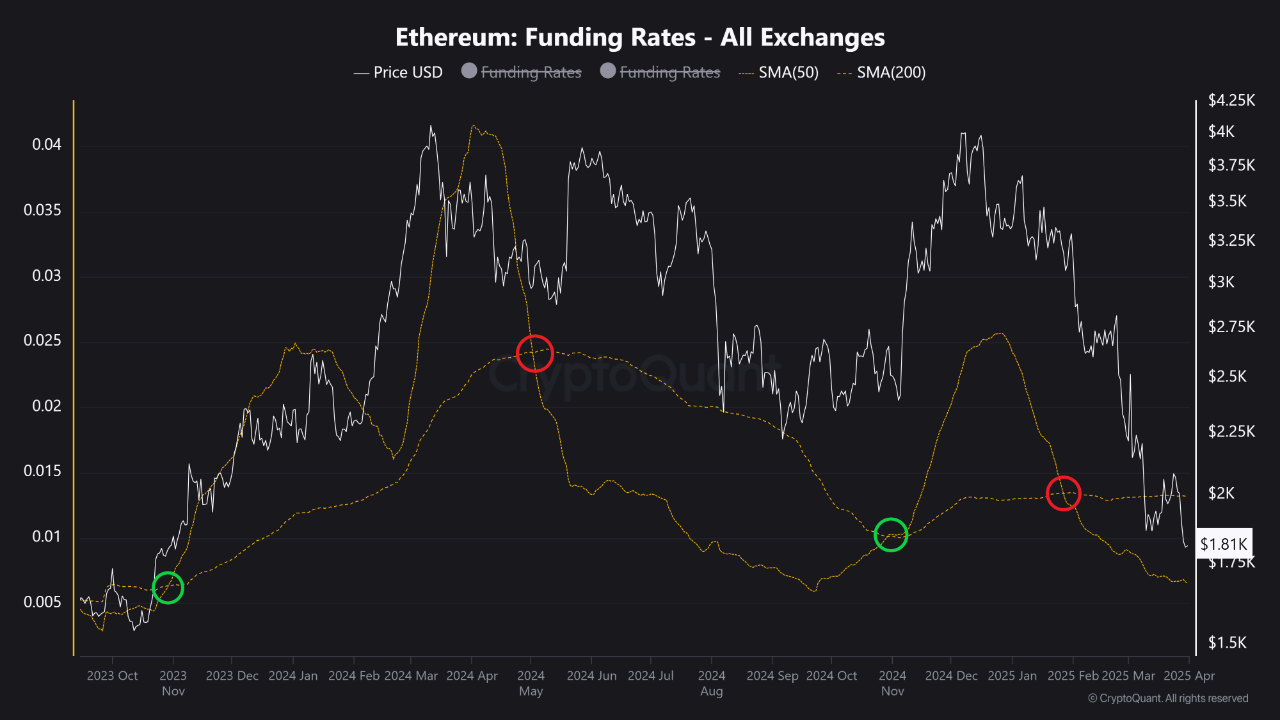 Source: CryptoQuant
How Have Past Indicators Predicted ETH Price Shifts?
Previous bullish and bearish crossovers of key Simple Moving Averages (SMAs), like the 50-day and 200-day, also aligned historically with major Ethereum price shifts.
A bullish SMA crossover in November 2023, for instance, preceded a significant rally that saw Ethereum rise above $4,000 by early 2024. Conversely, a bearish crossover observed in May 2024 marked the start of a sustained market downturn for ETH. Another recovery phase followed a bullish crossover in November 2024, but the most recent bearish SMA signal occurring in early 2025 coincided with the current price decline taking ETH below $2,000.
Spot Exchange Outflows Indicate Cautious Investor Behavior
Recent CoinGlass data reveals steady Ethereum spot exchange outflows. This continues a trend observed since December 2023, with past reports noting daily net outflows regularly exceeding $200 million during certain periods.
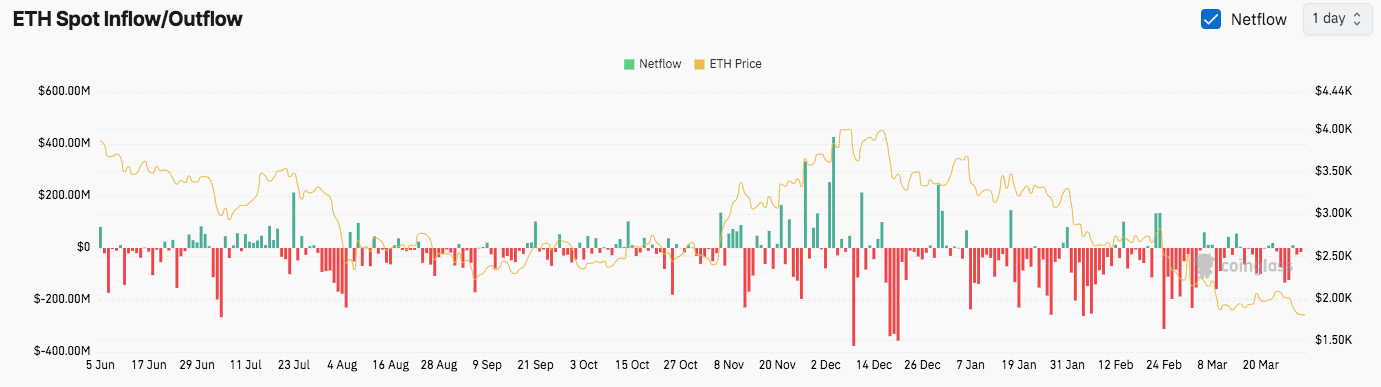 Source: Coinglass
This sustained outflow trend, which continued through March 2025, indicates investors consistently acquire Ethereum directly from centralized exchange platforms. While some of this movement may reflect a strategic shift to long-term self-custody or staking, it also notably corresponds with a significant loss in ETH’s upward price momentum since its prior cycle peak near $4,000.
The pattern of heavy outflows combined with declining prices suggests that at least some market participants may be positioning more defensively. This could involve reducing exposure to immediate trading environments during uncertain market conditions.
Technical Indicators Show Weak Momentum Despite Oversold Signals
During the time of writing, Ethereum was trading at $1,806.31 , recording a decline of 1.35% over the past day. Analysis of the 4-hour timeframe shows technical indicators like the Relative Strength Index (RSI) reading near 25.92, signaling technically oversold conditions.
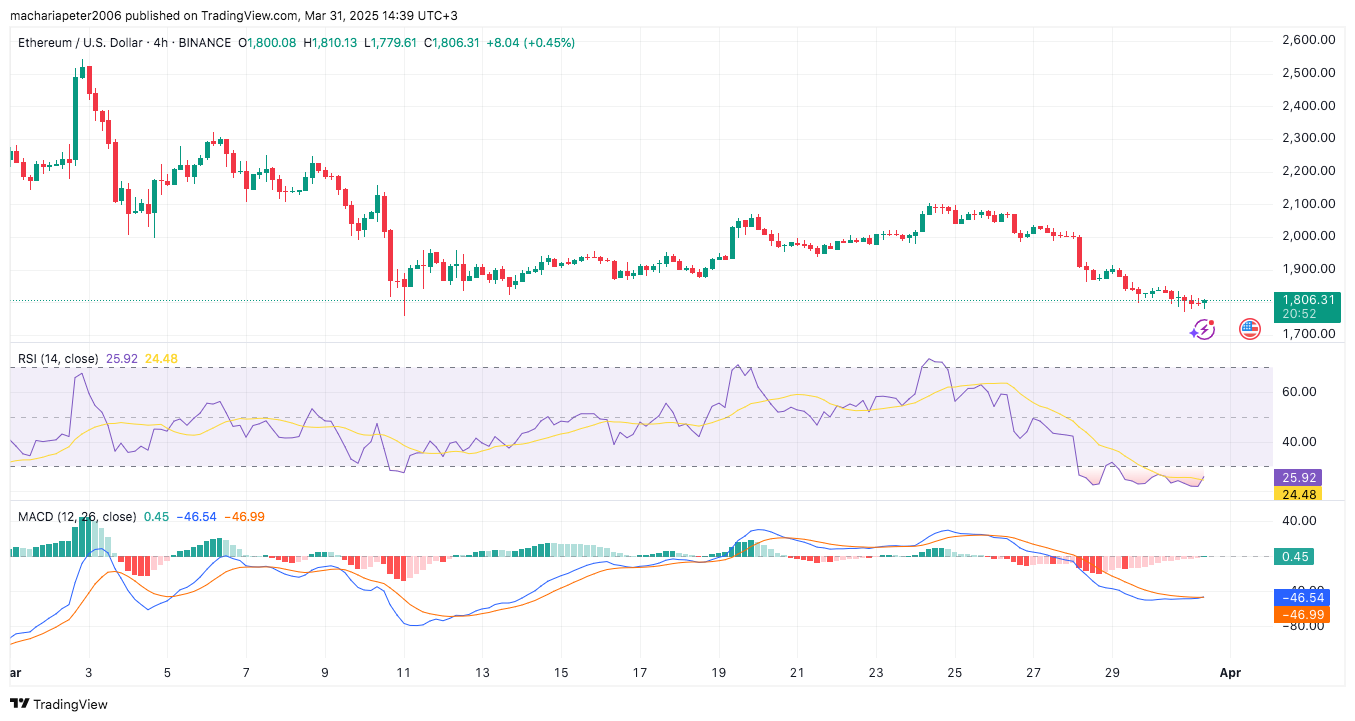 Source: TradingView
Additionally, the Moving Average Convergence Divergence (MACD) also signals weakness. Although the MACD line recently moved above its signal line (often a bullish hint), both lines remain in negative territory, and the histogram shows minimal positive divergence.
Therefore, the market currently lacks strong technical confirmation of an imminent trend reversal without a more decisive bullish indicator shift or an RSI recovery back above key levels like 30 or 40.
Disclaimer: The information presented in this article is for informational and educational purposes only. The article does not constitute financial advice or advice of any kind. Coin Edition is not responsible for any losses incurred as a result of the utilization of content, products, or services mentioned. Readers are advised to exercise caution before taking any action related to the company.