Cardano (ADA) Whales Drop To Two-Year Low As Key Support Gets Retested
Cardano’s price remains under pressure as whales exit and technicals confirm a strong downtrend, with $0.64 support under watch.
Cardano (ADA) is facing mounting pressure as its price corrects by 10% over the past seven days, continuing a broader downtrend that has kept it trading below the $1 mark for nearly a month. With technical indicators flashing warning signs and large holders exiting their positions, concerns around ADA’s short-term stability are growing.
The recent rejection at higher resistance levels and a strong directional trend signal suggest that bearish momentum is far from over. As the $0.64 support level is tested once again, ADA’s next move could determine whether a rebound is possible—or if further downside is ahead.
Cardano ADX Shows The Downtrend Is Very Strong
Cardano’s Average Directional Index (ADX) is currently at 40.19, rising sharply from 15.83 just four days ago. This steep increase suggests a rapid strengthening in the trend’s momentum.
Given that ADA is currently in a downtrend, the rising ADX indicates that bearish momentum is intensifying and the current downward move is gaining traction.
 ADA ADX. Source:
TradingView.
The ADX is a trend strength indicator that measures how strong a trend is, regardless of its direction. It ranges from 0 to 100, with readings below 20 typically indicating a weak or non-existent trend, while values above 25 suggest a strong trend is in place.
Cardano’s ADX climbing above 40 confirms that the current downtrend is active and becoming stronger. If this trend continues, it may point to further downside pressure unless a shift in momentum begins to build from the bulls.
ADA Whales Dropped To Their Lowest Level Since February 2023
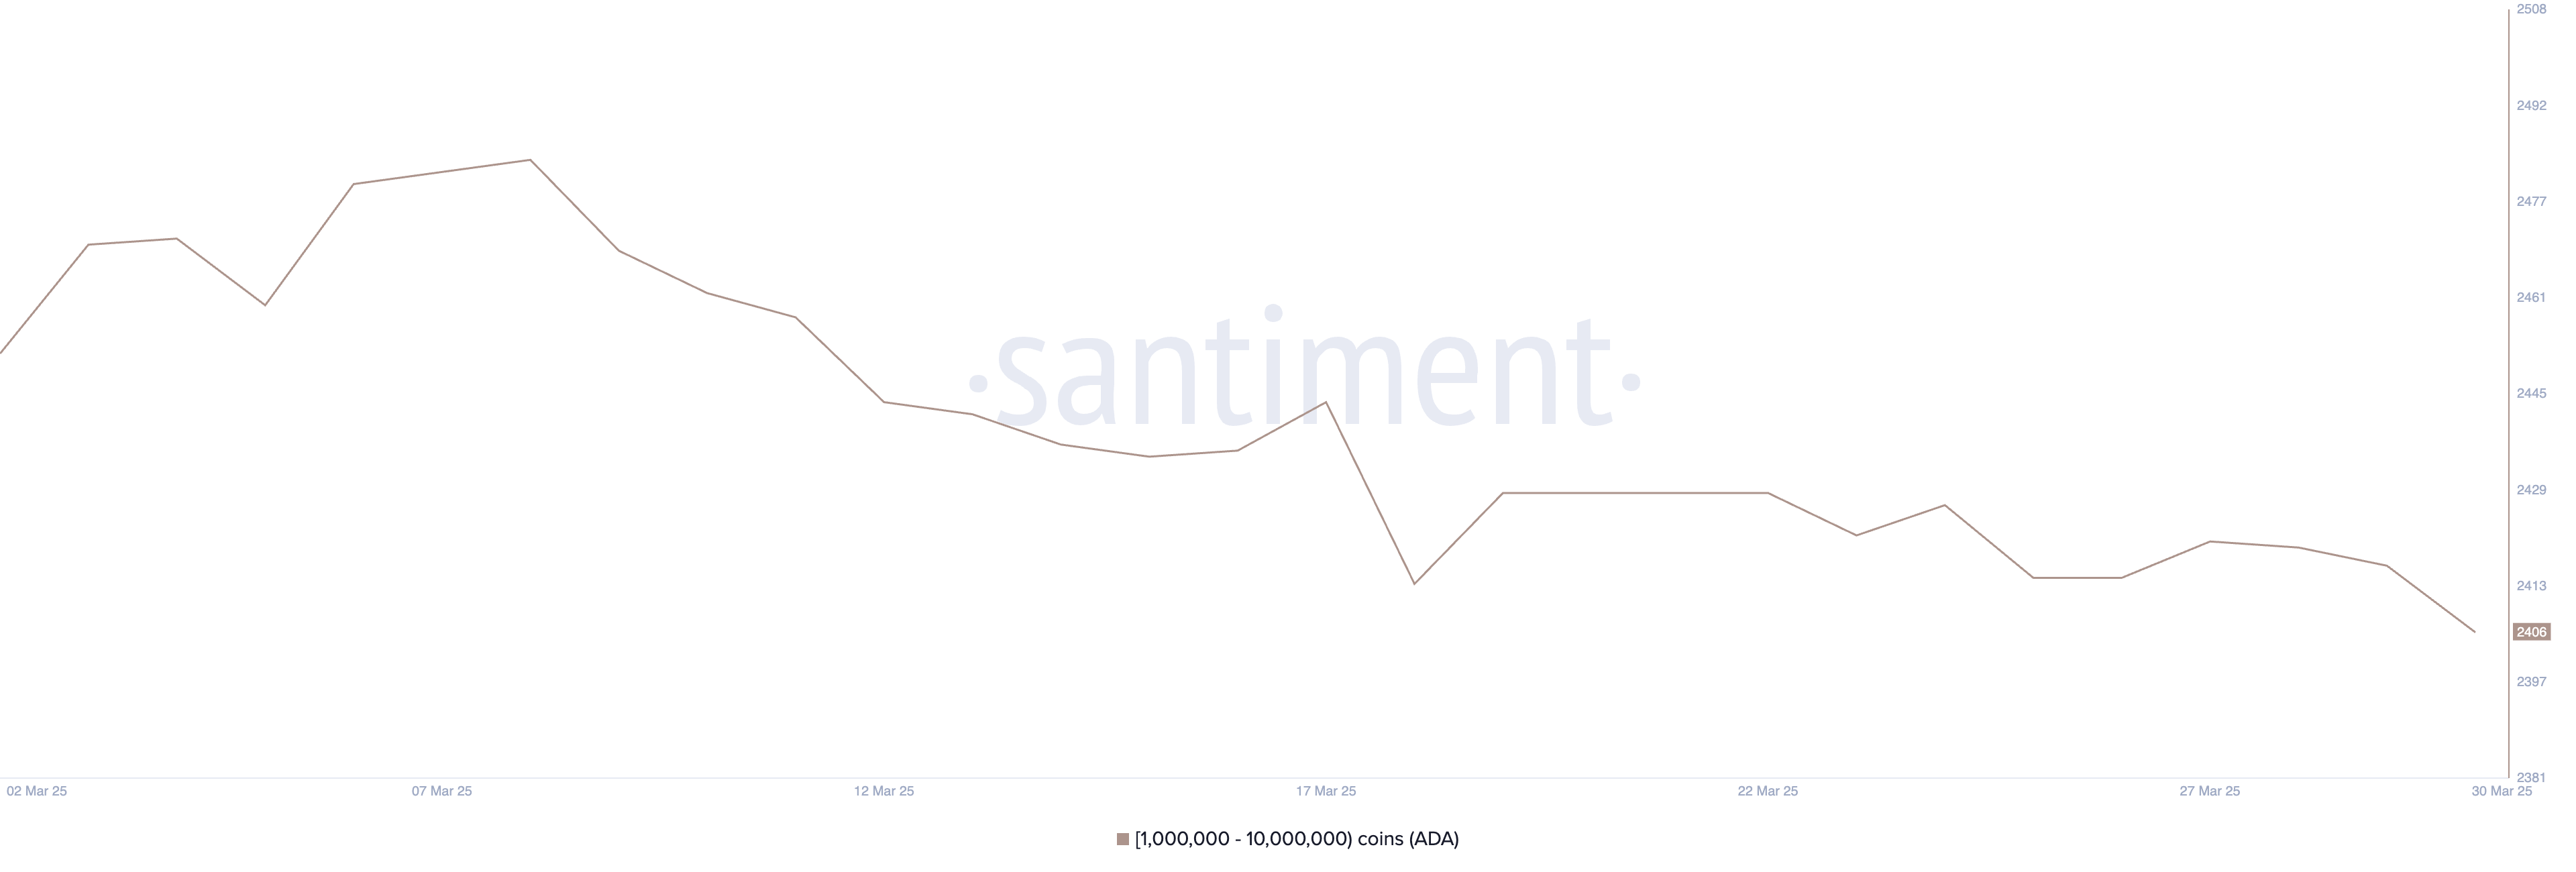
The number of Cardano whales—wallets holding between 1 million and 10 million ADA—has dropped to 2,406, down from 2,421 just four days ago.
This decline brings the whale count to its lowest level since February 2023, marking a potentially meaningful shift in large-holder behavior. These movements are worth paying attention to, as changes in whale holdings often precede broader market trends.
Tracking whales is important because these large holders can significantly influence price action through their buying or selling decisions. A decline in whale numbers can signal reduced confidence or capital rotation into other assets.
 Addresses Holding Between 1 Million and 10 Million ADA. Source:
Santiment.
In Cardano’s case, the drop suggests that some major players may be exiting or reducing exposure, which could add downward pressure to ADA’s price.
If this trend continues, it could weaken investor sentiment and make it harder for ADA to recover in the short term.
Can Cardano Sustain The $0.64 Support Again?
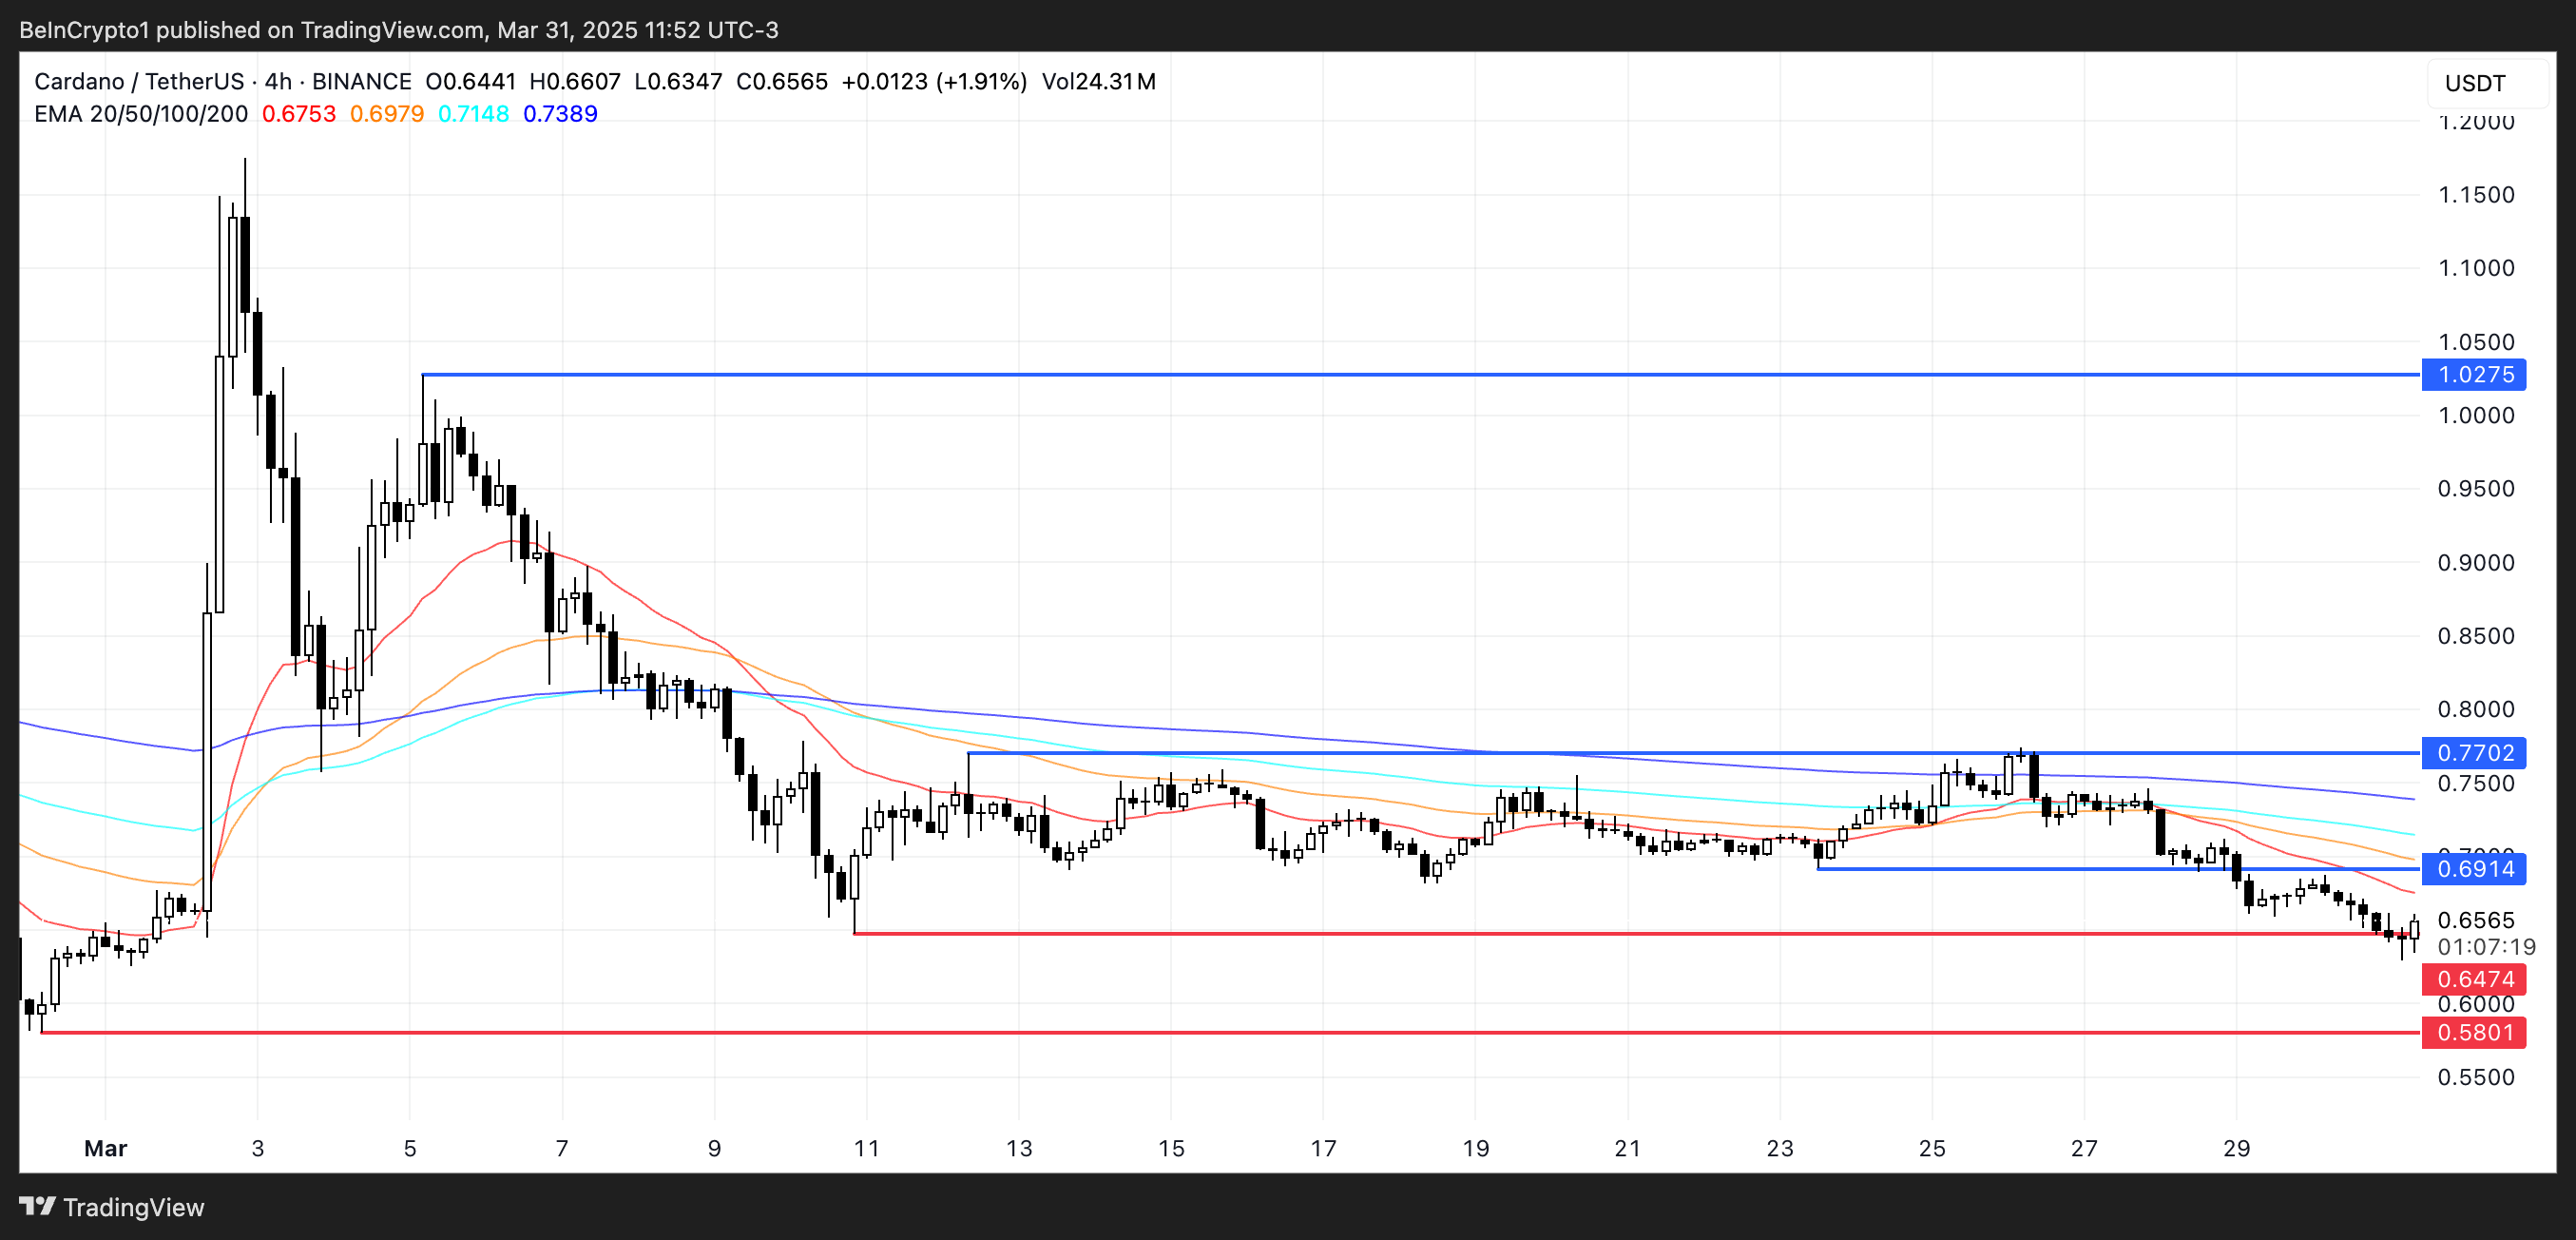
Cardano price recently tested the support level at $0.64 and managed to hold, showing that buyers are still defending that zone. This support has become a key line in the sand for ADA’s short-term outlook.
If the current downtrend is reversed and bullish momentum picks up, the next upside target would be the resistance at $0.69. A breakout above that level could open the door for a push toward $0.77.
 ADA Price Analysis. Source:
TradingView.
Should the rally continue with strength, ADA could aim for $1.02—marking a return above the $1 level for the first time since early March.
However, the $0.64 support remains a critical level to watch. If Cardano tests it again and fails to hold, it could indicate weakening buyer conviction.
A breakdown below $0.64 would likely send ADA toward the next support at $0.58. This would confirm a continuation of the downtrend and possibly trigger further selling pressure.
Disclaimer: The content of this article solely reflects the author's opinion and does not represent the platform in any capacity. This article is not intended to serve as a reference for making investment decisions.
You may also like
CandyBomb x US: Trade to share 5,400,000 US
[Initial Listing] Bitget to list Almanak (ALMANAK). Grab a share of 4,200,000 ALMANAK
[Initial listing] Bitget to list Cysic (CYS) in the Innovation zone
[Initial listing] Bitget to list Talus (US) in the Innovation and AI zone
