Bitget App
Trade smarter
Buy cryptoMarketsTradeFuturesEarnWeb3SquareMore
Trade
Spot
Buy and sell crypto with ease
Margin
Amplify your capital and maximize fund efficiency
Onchain
Going Onchain, without going Onchain!
Convert & block trade
Convert crypto with one click and zero fees
Explore
Launchhub
Gain the edge early and start winning
Copy
Copy elite trader with one click
Bots
Simple, fast, and reliable AI trading bot
Trade
USDT-M Futures
Futures settled in USDT
USDC-M Futures
Futures settled in USDC
Coin-M Futures
Futures settled in cryptocurrencies
Explore
Futures guide
A beginner-to-advanced journey in futures trading
Futures promotions
Generous rewards await
Overview
A variety of products to grow your assets
Simple Earn
Deposit and withdraw anytime to earn flexible returns with zero risk
On-chain Earn
Earn profits daily without risking principal
Structured Earn
Robust financial innovation to navigate market swings
VIP and Wealth Management
Premium services for smart wealth management
Loans
Flexible borrowing with high fund security
Is Movement (MOVE) Setting Up for Another Breakout Rally? Fractal Pattern Say Yes

Is Movement (MOVE) Setting Up for Another Breakout Rally? Fractal Pattern Say Yes

CoinsProbeCoinsProbe2025/04/01 07:45
By:Nilesh Hembade

Date: Tue, April 01, 2025 | 05:26 AM GMT

The cryptocurrency market has kicked off Q2 on a positive note after enduring a record-breaking bearish Q1. Ethereum (ETH) declined by over 44% during the first quarter, dragging most altcoins to multi-month lows.

Among the affected tokens, Movement (MOVE) also faced significant pressure, losing over 50% of its value over the last 90 days despite bullish news like accumulation by Trump-backed World Liberty Financial. However, today, MOVE is showing signs of a potential rebound, and its fractal chart suggests that another short-breakout rally might be on the horizon.

Is Movement (MOVE) Setting Up for Another Breakout Rally? Fractal Pattern Say Yes image 0 
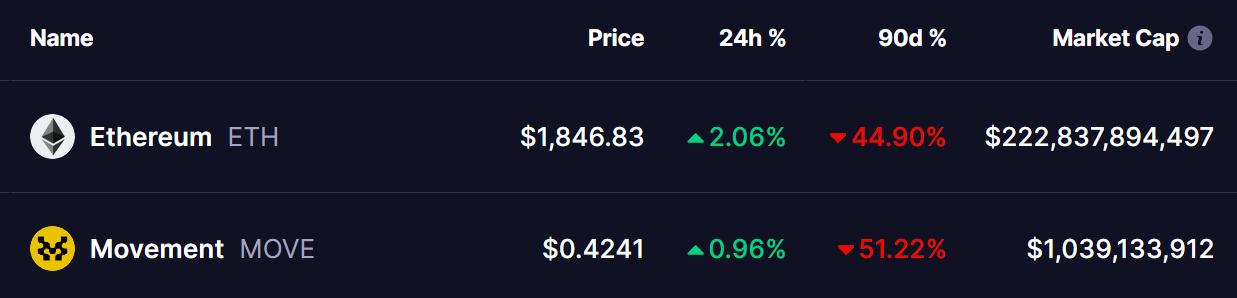
Source: Coinmarketcap

Familiar Breakout Pattern Forms

On the 4-hour chart, MOVE has broken above a falling wedge pattern and is currently trading at $0.42. A retest of the breakout level might occur before further upside movement.

Is Movement (MOVE) Setting Up for Another Breakout Rally? Fractal Pattern Say Yes image 1 
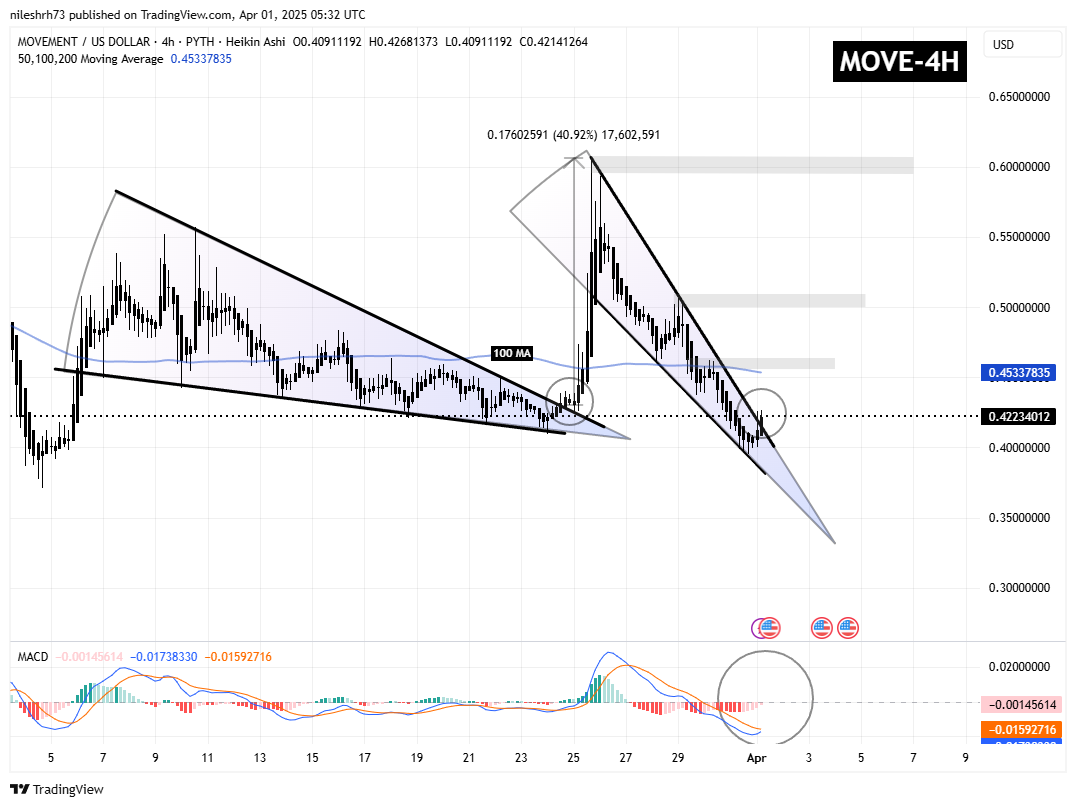
Movement (MOVE) 4H Chart/Coinsprobe (Source: Tradingview)

Interestingly, a similar breakout pattern was observed last week. During that instance, MOVE broke out of a falling wedge, briefly consolidated, and then surged over 40%, supported by the 100-day Moving Average (MA).

Now, MOVE is once again consolidating near the breakout area. If it mirrors past breakout behavior and successfully crosses the 100-day MA, this could confirm an uptrend and set the stage for another short-term rally. Potential upside targets include $0.46, $0.50, and $0.60, representing a 43% gain from the current price.

The MACD indicator at the bottom of the chart is also showing early signs of a bullish crossover.

Final Thoughts

MOVE’s recent price action suggests a potential breakout rally similar to previous instances. While the 100-day MA remains a key level to watch, a sustained move above it could trigger further gains. Traders should keep an eye on the upcoming retest and volume confirmation before positioning for the next big move.

Disclaimer: This article is for informational purposes only and not financial advice. Always conduct your own research before investing in cryptocurrencies.

0

Disclaimer: The content of this article solely reflects the author's opinion and does not represent the platform in any capacity. This article is not intended to serve as a reference for making investment decisions.

PoolX: Earn new token airdrops
Lock your assets and earn 10%+ APR
Lock now!

You may also like

New spot margin trading pair — HOLO/USDT!

Bitget Announcement2025/09/12 07:46

FUN drops by 32.34% within 24 hours as it faces a steep short-term downturn

- FUN plunged 32.34% in 24 hours to $0.008938, marking a 541.8% monthly loss amid prolonged bearish trends. - Technical breakdowns, elevated selling pressure, and forced liquidations highlight deteriorating market sentiment and risk-off behavior. - Analysts identify key support below $0.0080 as critical, with bearish momentum confirmed by RSI (<30) and MACD indicators. - A trend-following backtest strategy proposes short positions based on technical signals to capitalize on extended downward trajectories.

Bitget-RWA2025/09/12 06:14
FUN drops by 32.34% within 24 hours as it faces a steep short-term downturn

OPEN has dropped by 189.51% within 24 hours during a significant market pullback

- OPEN's price plummeted 189.51% in 24 hours to $0.8907, marking its largest intraday decline in history. - The token fell 3793.63% over 7 days, matching identical monthly and yearly declines, signaling severe bearish momentum. - Technical analysts cite broken support levels and lack of bullish catalysts as key drivers of the sustained sell-off. - Absence of stabilizing volume or reversal patterns leaves the market vulnerable to further downward pressure.

Bitget-RWA2025/09/12 06:14
OPEN has dropped by 189.51% within 24 hours during a significant market pullback

New spot margin trading pair — LINEA/USDT!

Bitget Announcement2025/09/11 10:04