
XRP Breakout Alert: Bullish Divergence Hints Stronger Bounce To $2.30

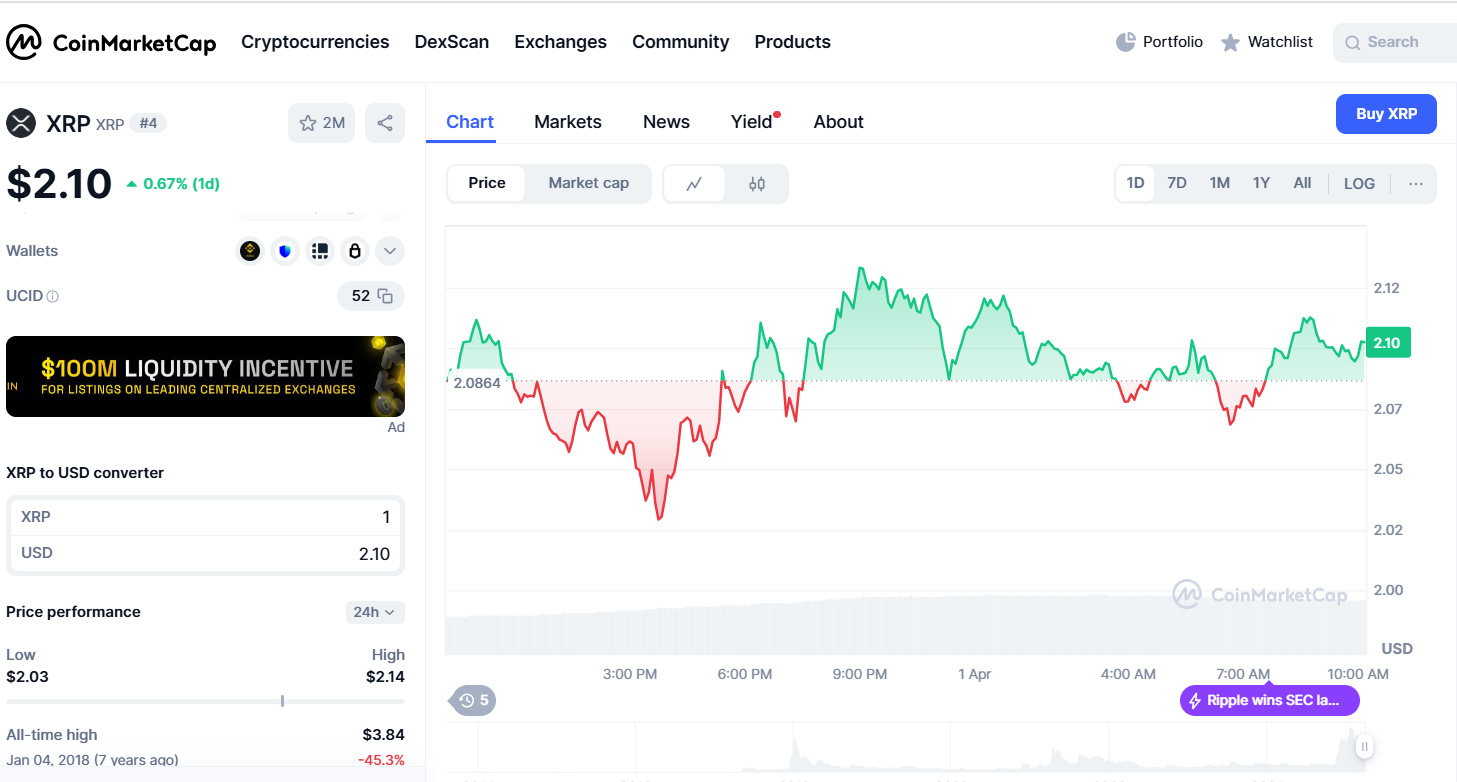
After hitting a low of $2.03, XRP has finally bounced back to the $2.10 level, showing a gain of more than 1%. However, the cryptocurrency has struggled over the past week, closing in the red during six of the last seven daily trading sessions. This weakness comes amid a broader slump in the crypto market, where falling prices and investor uncertainty have put pressure on most digital assets.
Currently, XRP’s price chart reveals a tug-of-war between bearish and bullish signals across different timeframes. On the 3-day chart, a strong bearish divergence remains active. This shows that although XRP’s price has been moving, the momentum behind those moves is not as strong as it appears. The situation has not changed significantly in the past day, suggesting that bearish pressure is still prevalent.
Bullish Divergence Emerging on the 8-Hour Chart
In contrast, the 8-hour chart shows signs of a bullish divergence. While XRP’s price has been posting lower lows, the Relative Strength Index (RSI)—a key momentum indicator—has been forming higher lows. This pattern suggests that despite the price declines, underlying momentum is strengthening. A stronger bounce in the RSI over the next day would provide additional confirmation of this potential reversal.
For the short term, sideways price action is expected, with a slight bullish bias. Historical patterns suggest that such setups often lead to either modest upward moves followed by consolidation or, in favorable conditions, more significant bullish rallies.
XRP’s price movements remain closely tied to Bitcoin and the broader cryptocurrency market. Unless Bitcoin experiences a substantial bullish breakout, XRP’s potential for a major price surge appears limited in the near term. Key support levels are identified between $1.95 and $2.05, where buying interest is likely to emerge if the price dips. Resistance is expected between $2.24 and $2.30, a zone where selling pressure tends to intensify.
Disclaimer: The content of this article solely reflects the author's opinion and does not represent the platform in any capacity. This article is not intended to serve as a reference for making investment decisions.
You may also like
New spot margin trading pair — HOLO/USDT!
FUN drops by 32.34% within 24 hours as it faces a steep short-term downturn
- FUN plunged 32.34% in 24 hours to $0.008938, marking a 541.8% monthly loss amid prolonged bearish trends. - Technical breakdowns, elevated selling pressure, and forced liquidations highlight deteriorating market sentiment and risk-off behavior. - Analysts identify key support below $0.0080 as critical, with bearish momentum confirmed by RSI (<30) and MACD indicators. - A trend-following backtest strategy proposes short positions based on technical signals to capitalize on extended downward trajectories.

OPEN has dropped by 189.51% within 24 hours during a significant market pullback
- OPEN's price plummeted 189.51% in 24 hours to $0.8907, marking its largest intraday decline in history. - The token fell 3793.63% over 7 days, matching identical monthly and yearly declines, signaling severe bearish momentum. - Technical analysts cite broken support levels and lack of bullish catalysts as key drivers of the sustained sell-off. - Absence of stabilizing volume or reversal patterns leaves the market vulnerable to further downward pressure.

New spot margin trading pair — LINEA/USDT!