
Solana (SOL) Holds Steady After Decline—Breakout or More Downside?

Solana started a fresh decline below the $132 support zone. SOL price is now consolidating and might struggle to recover above the $126 resistance.
- SOL price started a recovery wave from the $122 support zone against the US Dollar.
- The price is now trading below $130 and the 100-hourly simple moving average.
- There is a key rising channel forming with support at $124 on the hourly chart of the SOL/USD pair (data source from Kraken).
- The pair could start a fresh increase if the bulls clear the $126 zone.
Solana Price Faces Resistance
Solana price started a fresh decline below the $135 and $132 levels, like Bitcoin and Ethereum. SOL even declined below the $125 support level before the bulls appeared.
A low was formed at $122.64 and the price recently started a consolidation phase. There was a minor increase above the $125 level. The price tested the 23.6% Fib retracement level of the downward move from the $140 swing high to the $122 low.
Solana is now trading below $126 and the 100-hourly simple moving average. There is also a key rising channel forming with support at $124 on the hourly chart of the SOL/USD pair.
On the upside, the price is facing resistance near the $126 level. The next major resistance is near the $128 level. The main resistance could be $132 or the 50% Fib retracement level of the downward move from the $140 swing high to the $122 low.
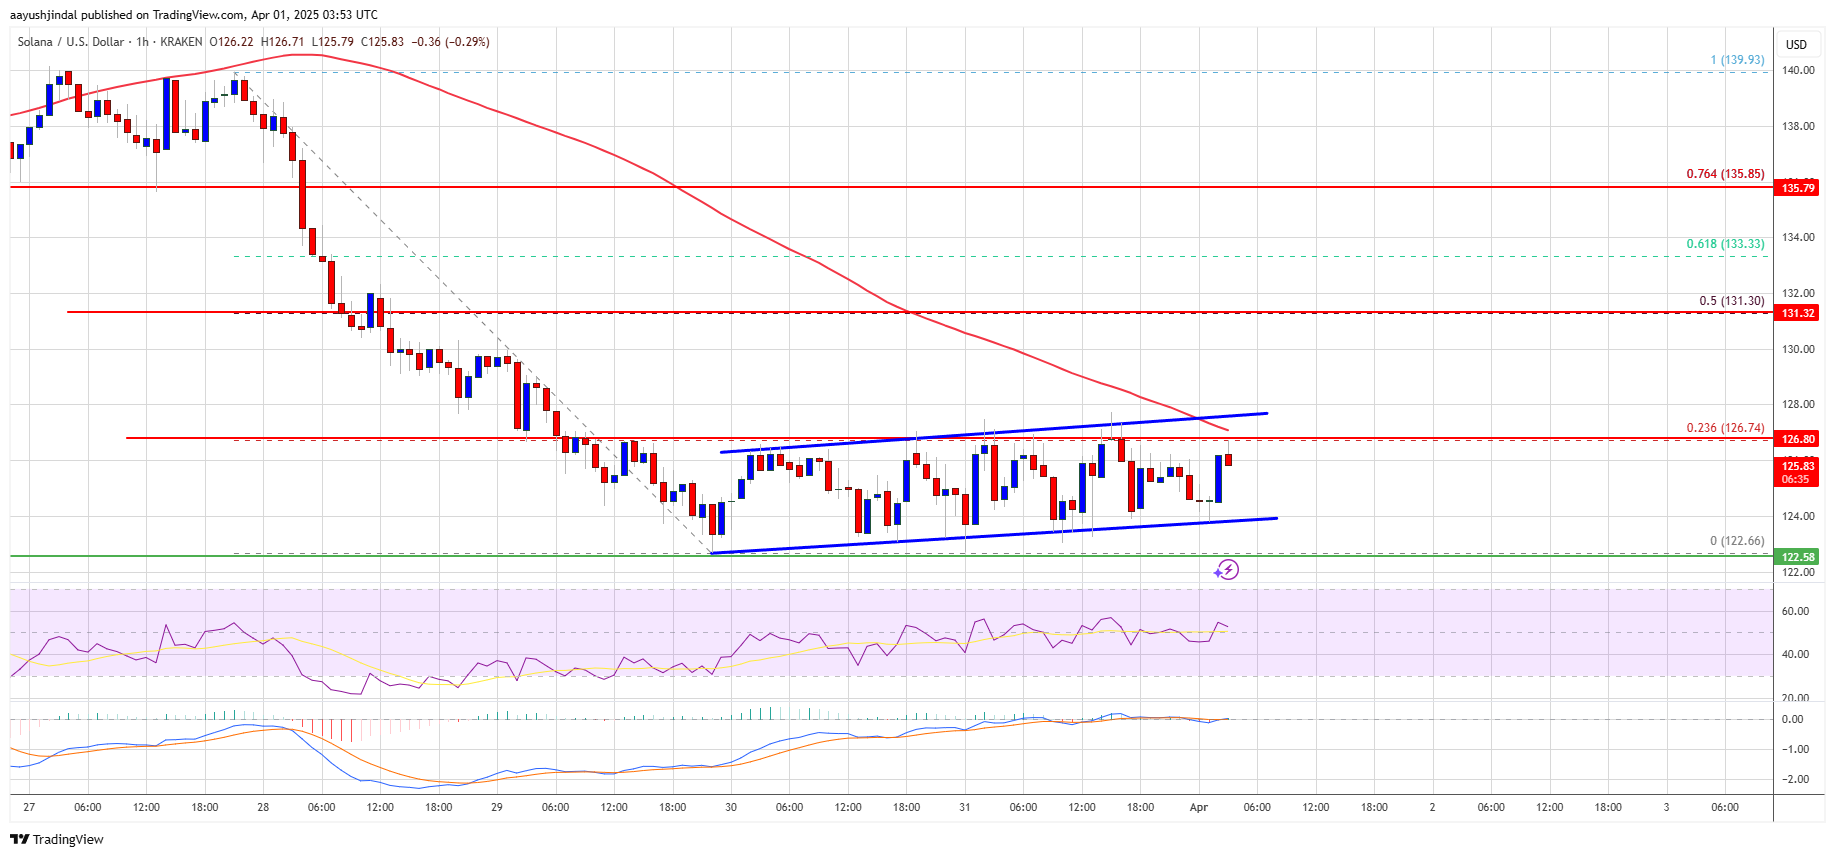
A successful close above the $132 resistance zone could set the pace for another steady increase. The next key resistance is $136. Any more gains might send the price toward the $142 level.
Another Decline in SOL?
If SOL fails to rise above the $128 resistance, it could start another decline. Initial support on the downside is near the $124 zone. The first major support is near the $122 level.
A break below the $122 level might send the price toward the $115 zone. If there is a close below the $115 support, the price could decline toward the $102 support in the near term.
Technical Indicators
Hourly MACD – The MACD for SOL/USD is losing pace in the bearish zone.
Hourly Hours RSI (Relative Strength Index) – The RSI for SOL/USD is above the 50 level.
Major Support Levels – $124 and $122.
Major Resistance Levels – $128 and $132.
Disclaimer: The content of this article solely reflects the author's opinion and does not represent the platform in any capacity. This article is not intended to serve as a reference for making investment decisions.
You may also like
New spot margin trading pair — HOLO/USDT!
FUN drops by 32.34% within 24 hours as it faces a steep short-term downturn
- FUN plunged 32.34% in 24 hours to $0.008938, marking a 541.8% monthly loss amid prolonged bearish trends. - Technical breakdowns, elevated selling pressure, and forced liquidations highlight deteriorating market sentiment and risk-off behavior. - Analysts identify key support below $0.0080 as critical, with bearish momentum confirmed by RSI (<30) and MACD indicators. - A trend-following backtest strategy proposes short positions based on technical signals to capitalize on extended downward trajectories.

OPEN has dropped by 189.51% within 24 hours during a significant market pullback
- OPEN's price plummeted 189.51% in 24 hours to $0.8907, marking its largest intraday decline in history. - The token fell 3793.63% over 7 days, matching identical monthly and yearly declines, signaling severe bearish momentum. - Technical analysts cite broken support levels and lack of bullish catalysts as key drivers of the sustained sell-off. - Absence of stabilizing volume or reversal patterns leaves the market vulnerable to further downward pressure.

New spot margin trading pair — LINEA/USDT!