

- Cardano (ADA) bounces ~3% to ~$0.673, testing key $0.675 resistance level
- Holding new $0.652 support crucial; break above $0.675 targets $0.68+
- RSI neutral (~43), MACD weak; breakout needed to confirm bullish strength
Cardano (ADA) showed strong signs of recovery in the short term; Tuesday saw bullish momentum pushing ADA prices higher. ADA currently trades near $0.6710 , marking a 3.19% gain over the past 24 hours.
This recent uptick followed a consolidation period where ADA found support at lower levels before breaking higher again. Increased buying pressure and a notable surge in trading volume suggest potential continuation of this uptrend.
However, key overhead resistance levels must be monitored closely to confirm further positive movement for April 2nd.
Cardano’s Short-Term Trend and Market Sentiment
ADA has been trending upwards, supported by a recent rebound from $0.622 level. That price point previously acted as a temporary market bottom. Current bullish sentiment is evident as buyers actively defend crucial nearby support zones.
Trading volume for ADA increased sharply by over 50% in the past 24 hours. This suggests market participants feel some confidence in sustaining the current rally attempt. But a firm breakout above immediate resistance is required to solidify that bullish strength definitively.
Related: ADA Trading Volume Explodes, Whales Pile In: ADA Price Surge to $2 Around the Corner?
What Are Key ADA Support and Resistance Levels?
Price action indicates the $0.6523 level has transitioned from former resistance into potential current support for ADA.
This level previously acted as a barrier to upward movement. The recent breakout above it turned it into a possible foundation for further gains. Below this, the $0.640–$0.645 range represents a consolidation zone where ADA stabilized previously before attempting its latest move higher.
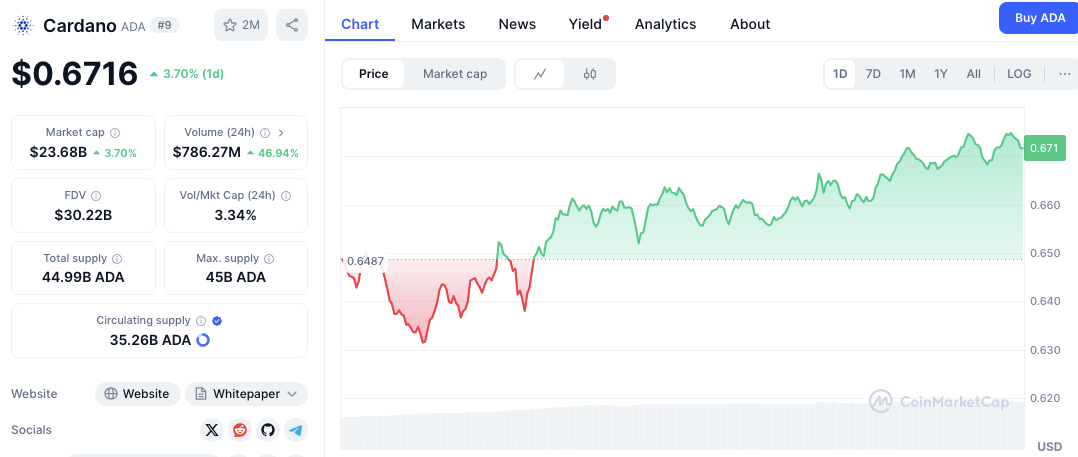 Source: CoinMarketCap
If significant bearish pressure returns unexpectedly, the $0.620 level serves as a strong nearby support area. It marks the recent swing low that could provide a solid base in case of a market pullback.
On the resistance side, ADA currently tests the immediate price range between $0.673–$0.675.
A successful push above this zone could pave the way for the next target at $0.680 and beyond. If buying momentum continues, ADA may advance toward the $0.69–$0.70 region, a key psychological and technical barrier.
What Do Technical Indicators Signal for April 2nd?
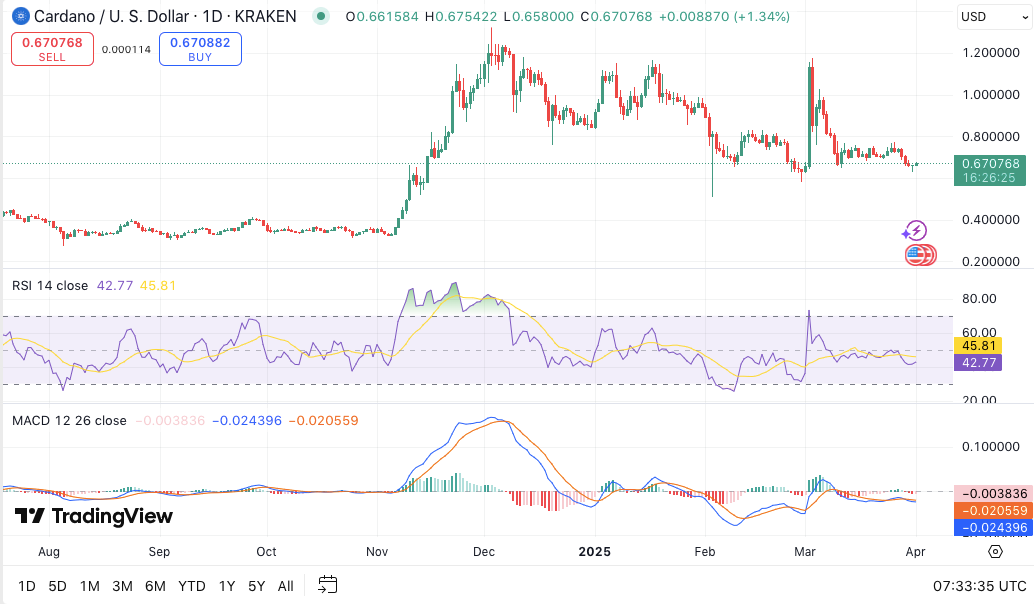 ADA/USD daily price chart, Source: TradingView
The Relative Strength Index (RSI) stands at 42.99, reflecting neutral-to-slightly oversold conditions.
If the RSI were to dip back below 40, further downside pressure could emerge. However, a decisive move above the 50 mark would help confirm renewed bullish strength, possibly signaling trend continuation for Cardano heading into April.
Related: Cardano (ADA) Price Analysis: 25% Crash Deep Dive — Expert Price Prediction: $10 Rebound Possible Despite Bearish Trend
Meanwhile, the Moving Average Convergence Divergence (MACD) indicator suggests mild bearish momentum, with the MACD line at -0.024277 positioned slightly below the signal line at -0.020536.
Although this indicates short-term weakness, a crossover could shift sentiment in favor of buyers.
If the MACD line achieves a clear bullish crossover above the signal line soon, particularly combined with increasing volume, it would reinforce the potential for the current recovery attempt to continue into April.
Disclaimer: The information presented in this article is for informational and educational purposes only. The article does not constitute financial advice or advice of any kind. Coin Edition is not responsible for any losses incurred as a result of the utilization of content, products, or services mentioned. Readers are advised to exercise caution before taking any action related to the company.

