

Date: Wed, April 02, 2025 | 08:42 AM GMT
The cryptocurrency market has just witnessed a record-breaking bearish Q1, with Ethereum (ETH) suffering its largest drop since 2018, plunging 45%. This widespread decline has dragged most altcoins down, and Sonic (S) (formerly Fantom – FTM) was no exception, experiencing a sharp 37% drop in value.
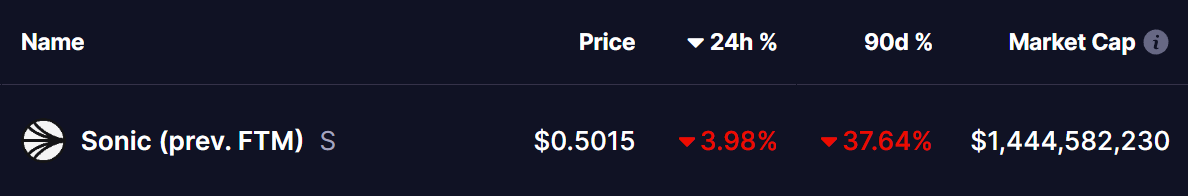 Source: Coinmarketcap
However, after bearish sentiment, Sonic (S) is now flashing technical signals that have historically preceded strong trend reversals. With a well-defined pattern forming on its weekly chart, could this setup indicate a major recovery in the making?
Broadening Wedge Setup: Repeating History for a Recovery?
Sonic’s weekly chart highlights a broadening wedge pattern, a formation typically seen as bearish. However, there is still room for an upside move before any potential breakdown. The latest correction began when Sonic (S) faced rejection from the upper resistance trendline at $1.47 in mid-December (marked by the red arrow), triggering a sharp decline of over 75% toward the lower support trendline.
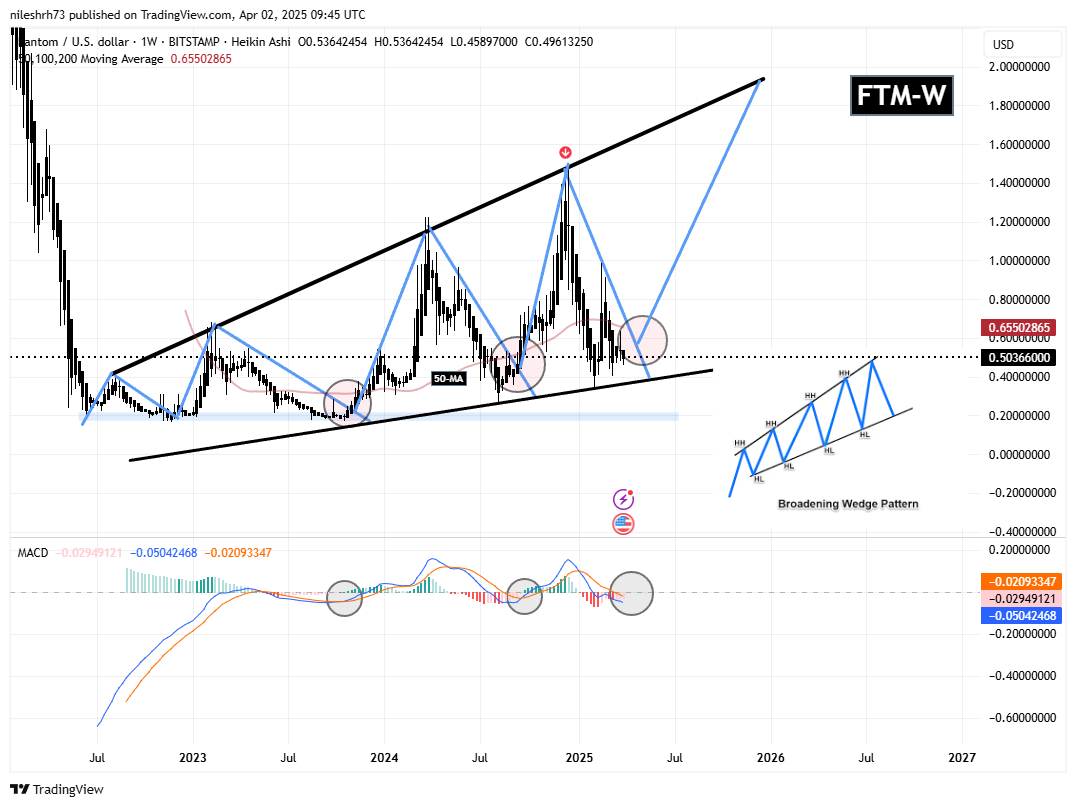 Sonic (S) Weekly Chart/Coinsprobe (Source: Tradingview)
Following this drop, Sonic (S) tested the lower trendline support at $0.33 and has since rebounded slightly, now trading around $0.50. Interestingly, as the chart reveals, several key similarities are emerging, particularly in the MACD indicator (marked with red circles) and the 50-day MA breakout zone.
If Sonic (S) follows a similar breakout pattern to previous instances, a move from this MACD signal, along with a successful breakout above the 50-day moving average, could confirm a strong recovery rally. This rally may drive Sonic’s price toward the upper resistance trendline, located around the $1.90 range—representing a potential 275% surge from current levels.
What’s Ahead?
With the market still volatile, Sonic (S) traders will closely monitor whether the price can successfully reclaim the 50-day MA. A clean break above this level could confirm the beginning of a new bullish cycle, while failure to hold recent support could lead to further downside.
Disclaimer: This article is for informational purposes only and not financial advice. Always conduct your own research before investing in cryptocurrencies.

