

On the daily chart, bitcoin’s price action has shifted significantly downward, falling from a local high near $94,422 to approximately $74,434. The presence of consecutive bearish candles and increasing bearish volume indicates strong selling conviction. While psychological support may exist around the $74,000 mark, no technical bottom has formed yet. The chart reflects bearish dominance, but an oversold bounce could materialize if momentum pauses. Traders should watch for a bullish engulfing or hammer pattern near $74,000 as a potential entry signal, while failed rallies toward the $78,000–$80,000 zone may provide shorting opportunities.
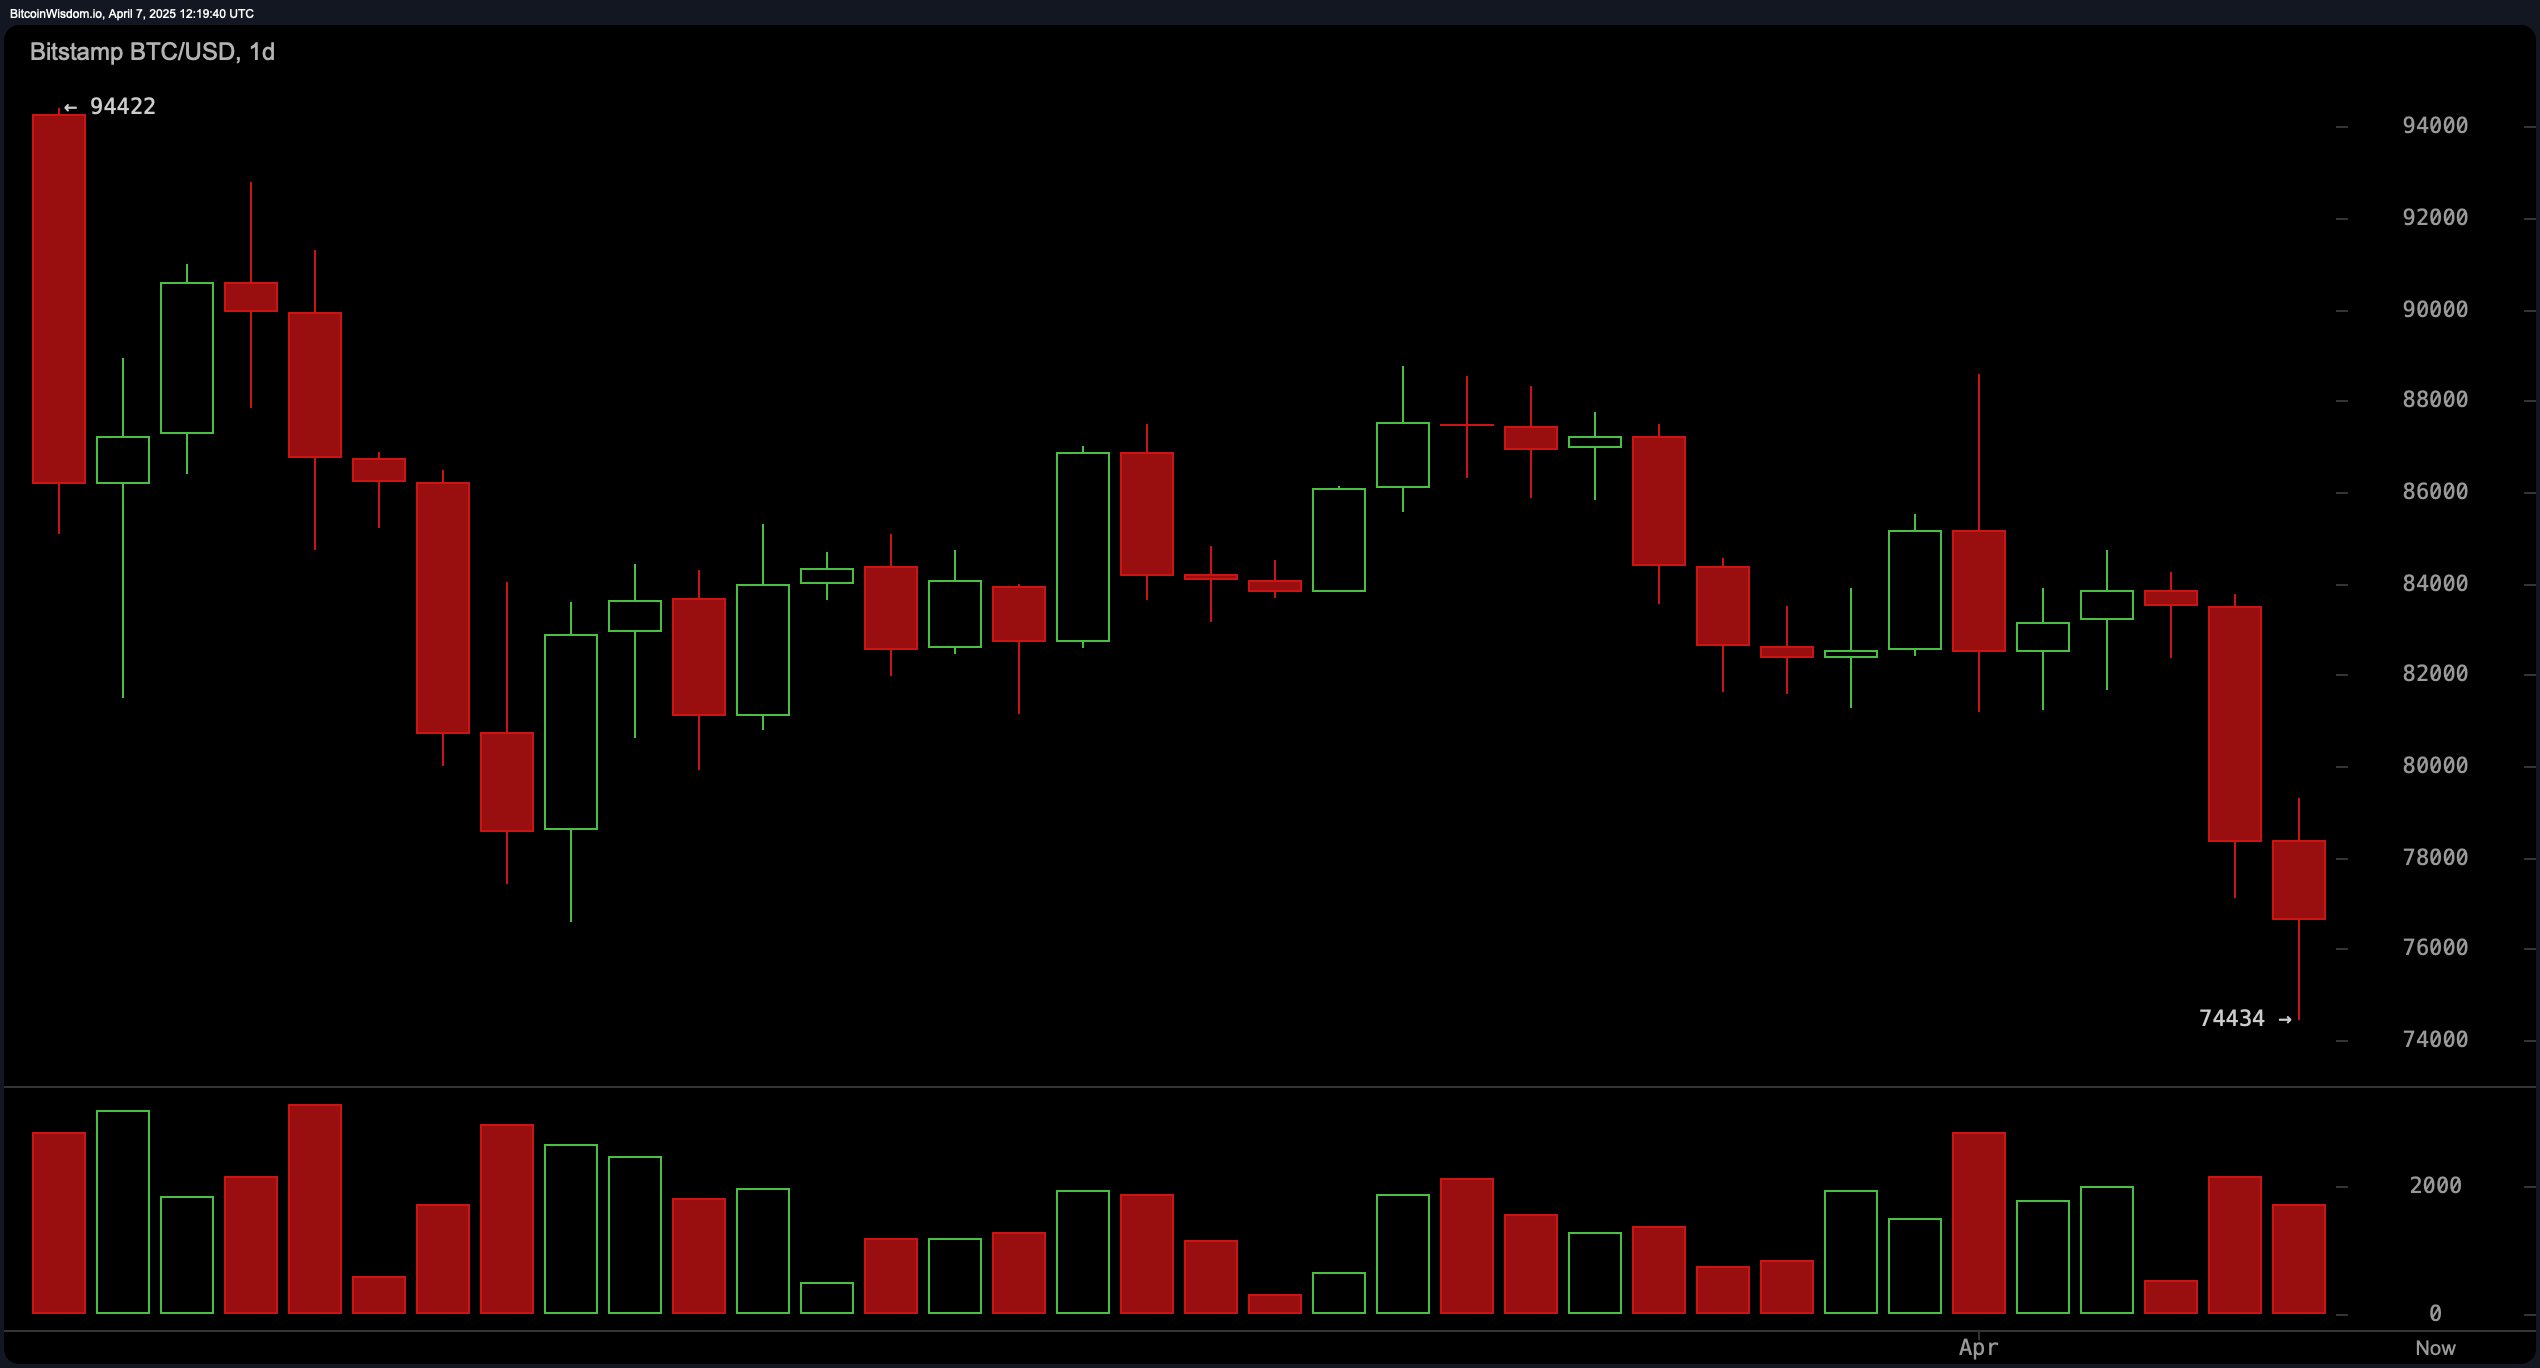
BTC/USD 1D chart via Bitstamp on April 7, 2025.
The 4-hour chart reinforces the bearish sentiment with a massive bearish engulfing candle printed near $88,563, marking the beginning of a downtrend characterized by lower highs and lower lows. A short-term support zone appears to be holding around $74,434, but volume has decreased since the initial breakdown, pointing to potential exhaustion. While there is room for a temporary bounce to $78,000–$79,000, the prevailing trend remains bearish unless that level is reclaimed decisively. Scalp longs are feasible above $75,500 with tight stops, while shorts can be considered at the $78,000–$80,000 resistance zone.
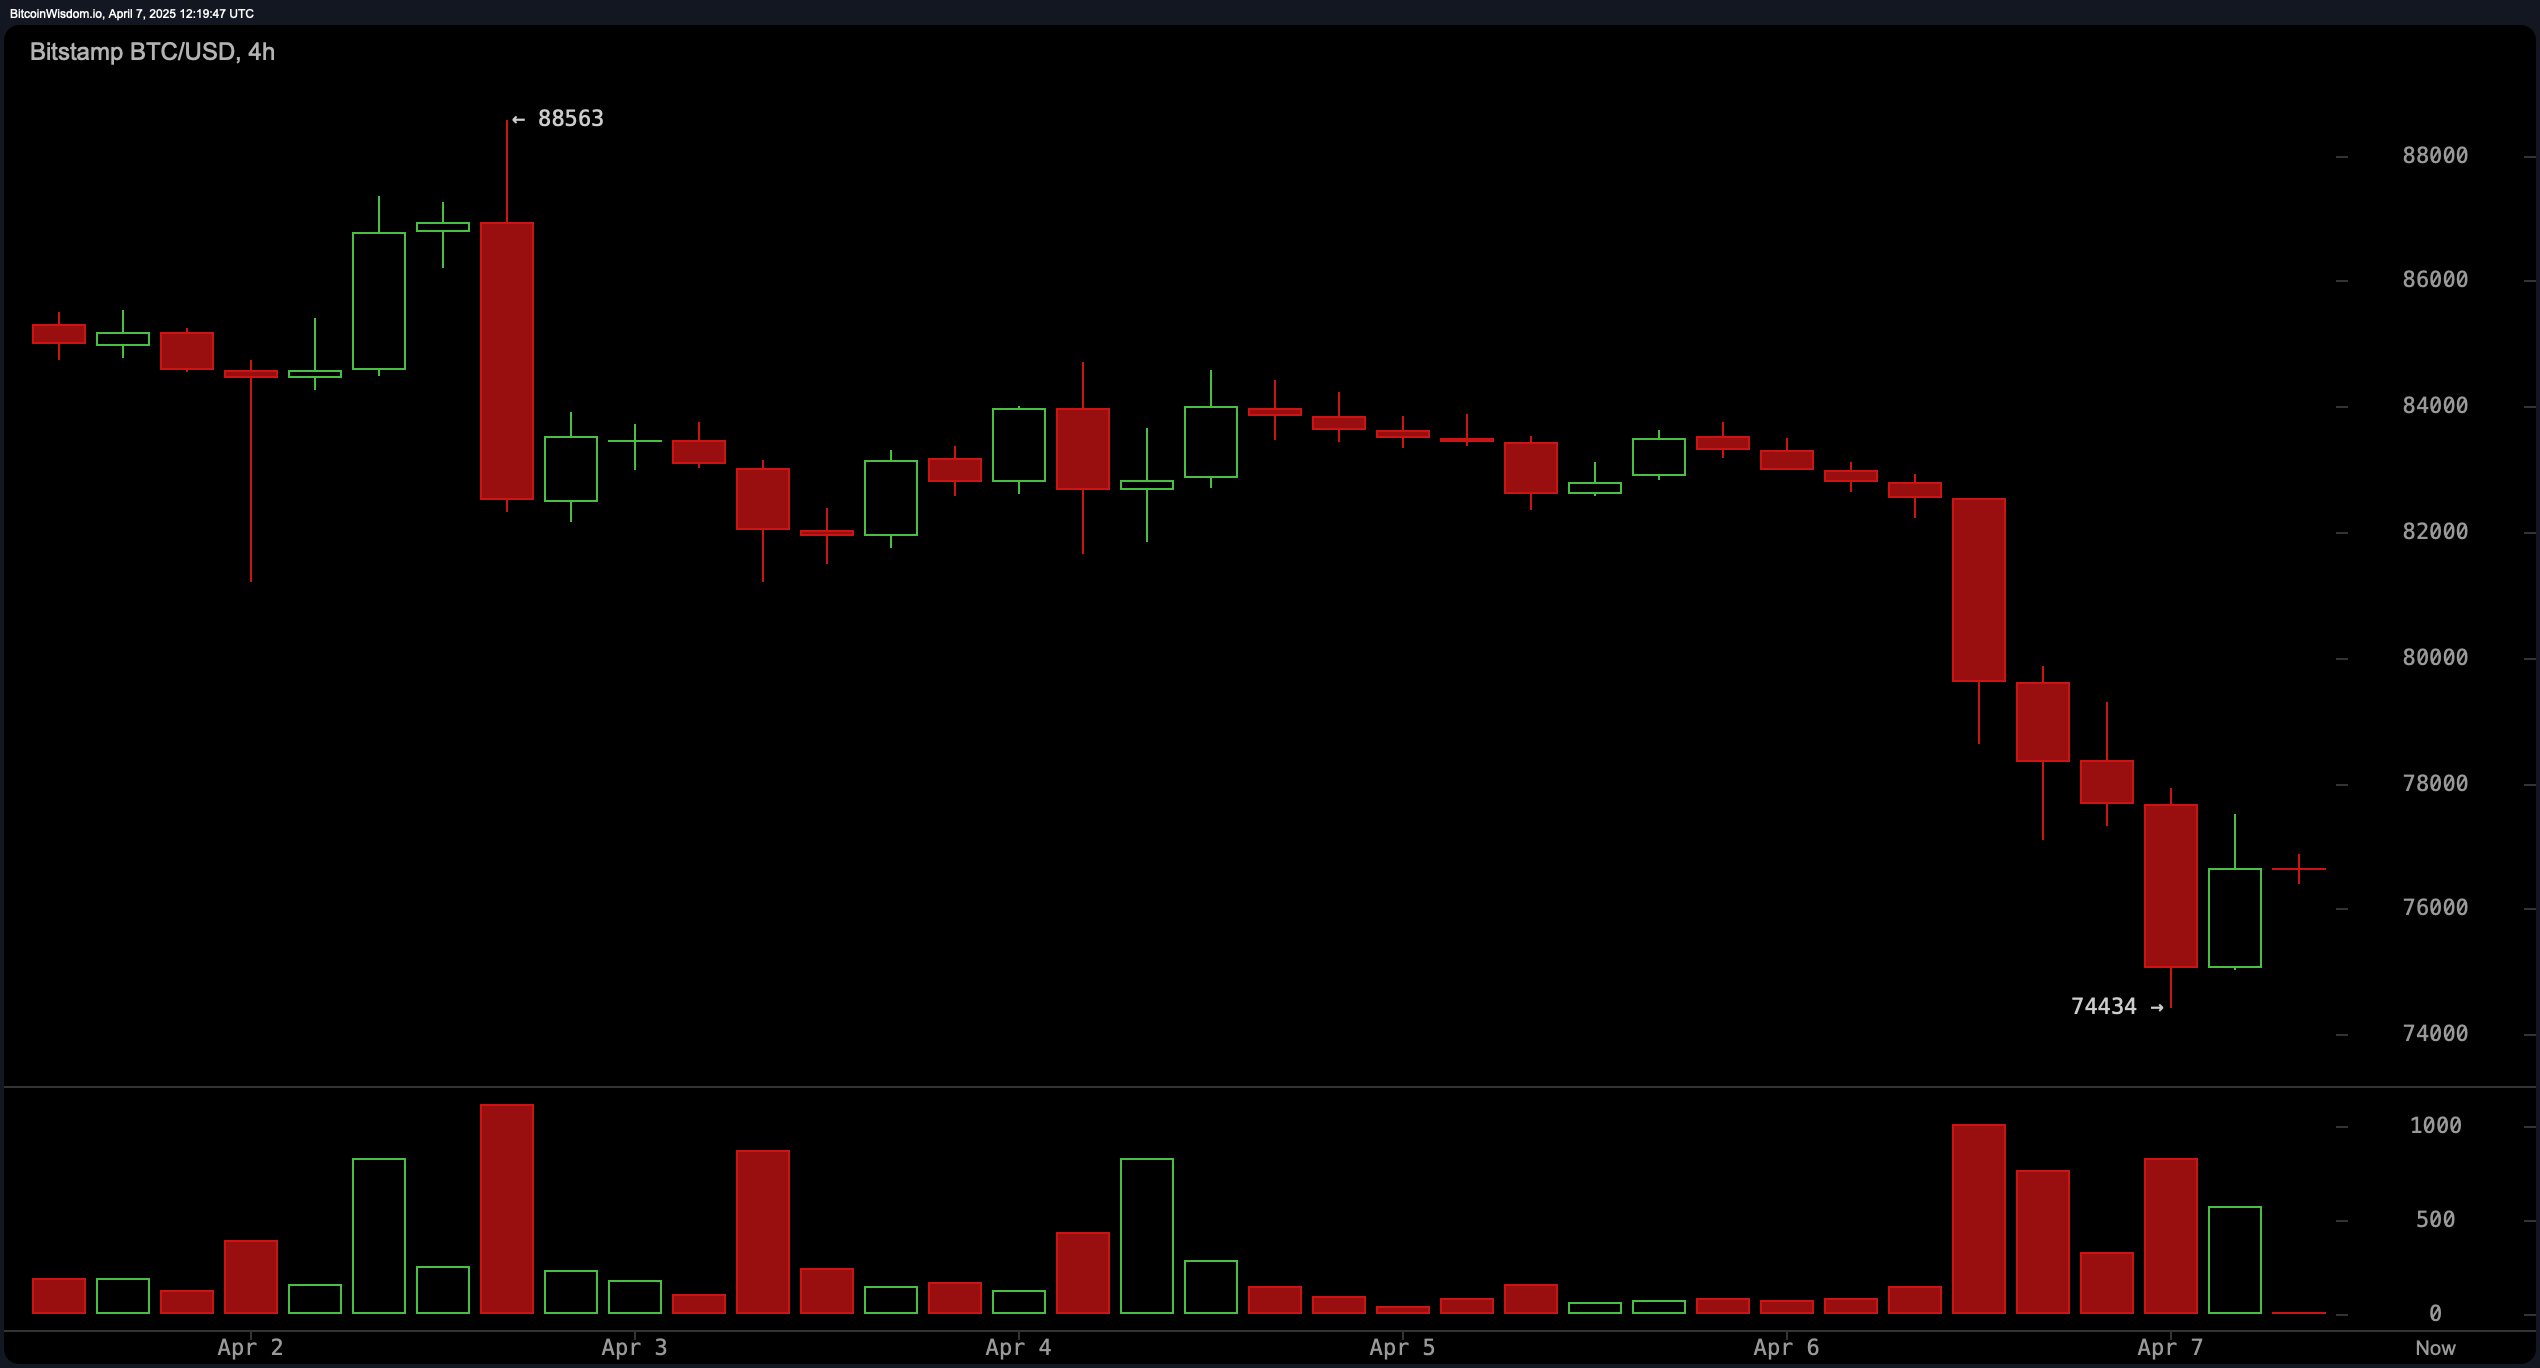
BTC/USD 4H chart via Bitstamp on April 7, 2025.
On the 1-hour chart, bitcoin’s decline from $83,741 to the recent low around $74,434 illustrates a rapid loss in value, followed by a weak relief rally. The lack of volume accompanying the bounce signals a lack of conviction from buyers. If price action continues forming lower highs, such as around $77,000, it could serve as a near-term short entry level. Conservative buyers might await a retest and confirmation bounce from $74,500–$75,000, whereas intraday traders could consider long entries above $77,500 only if volume confirms.
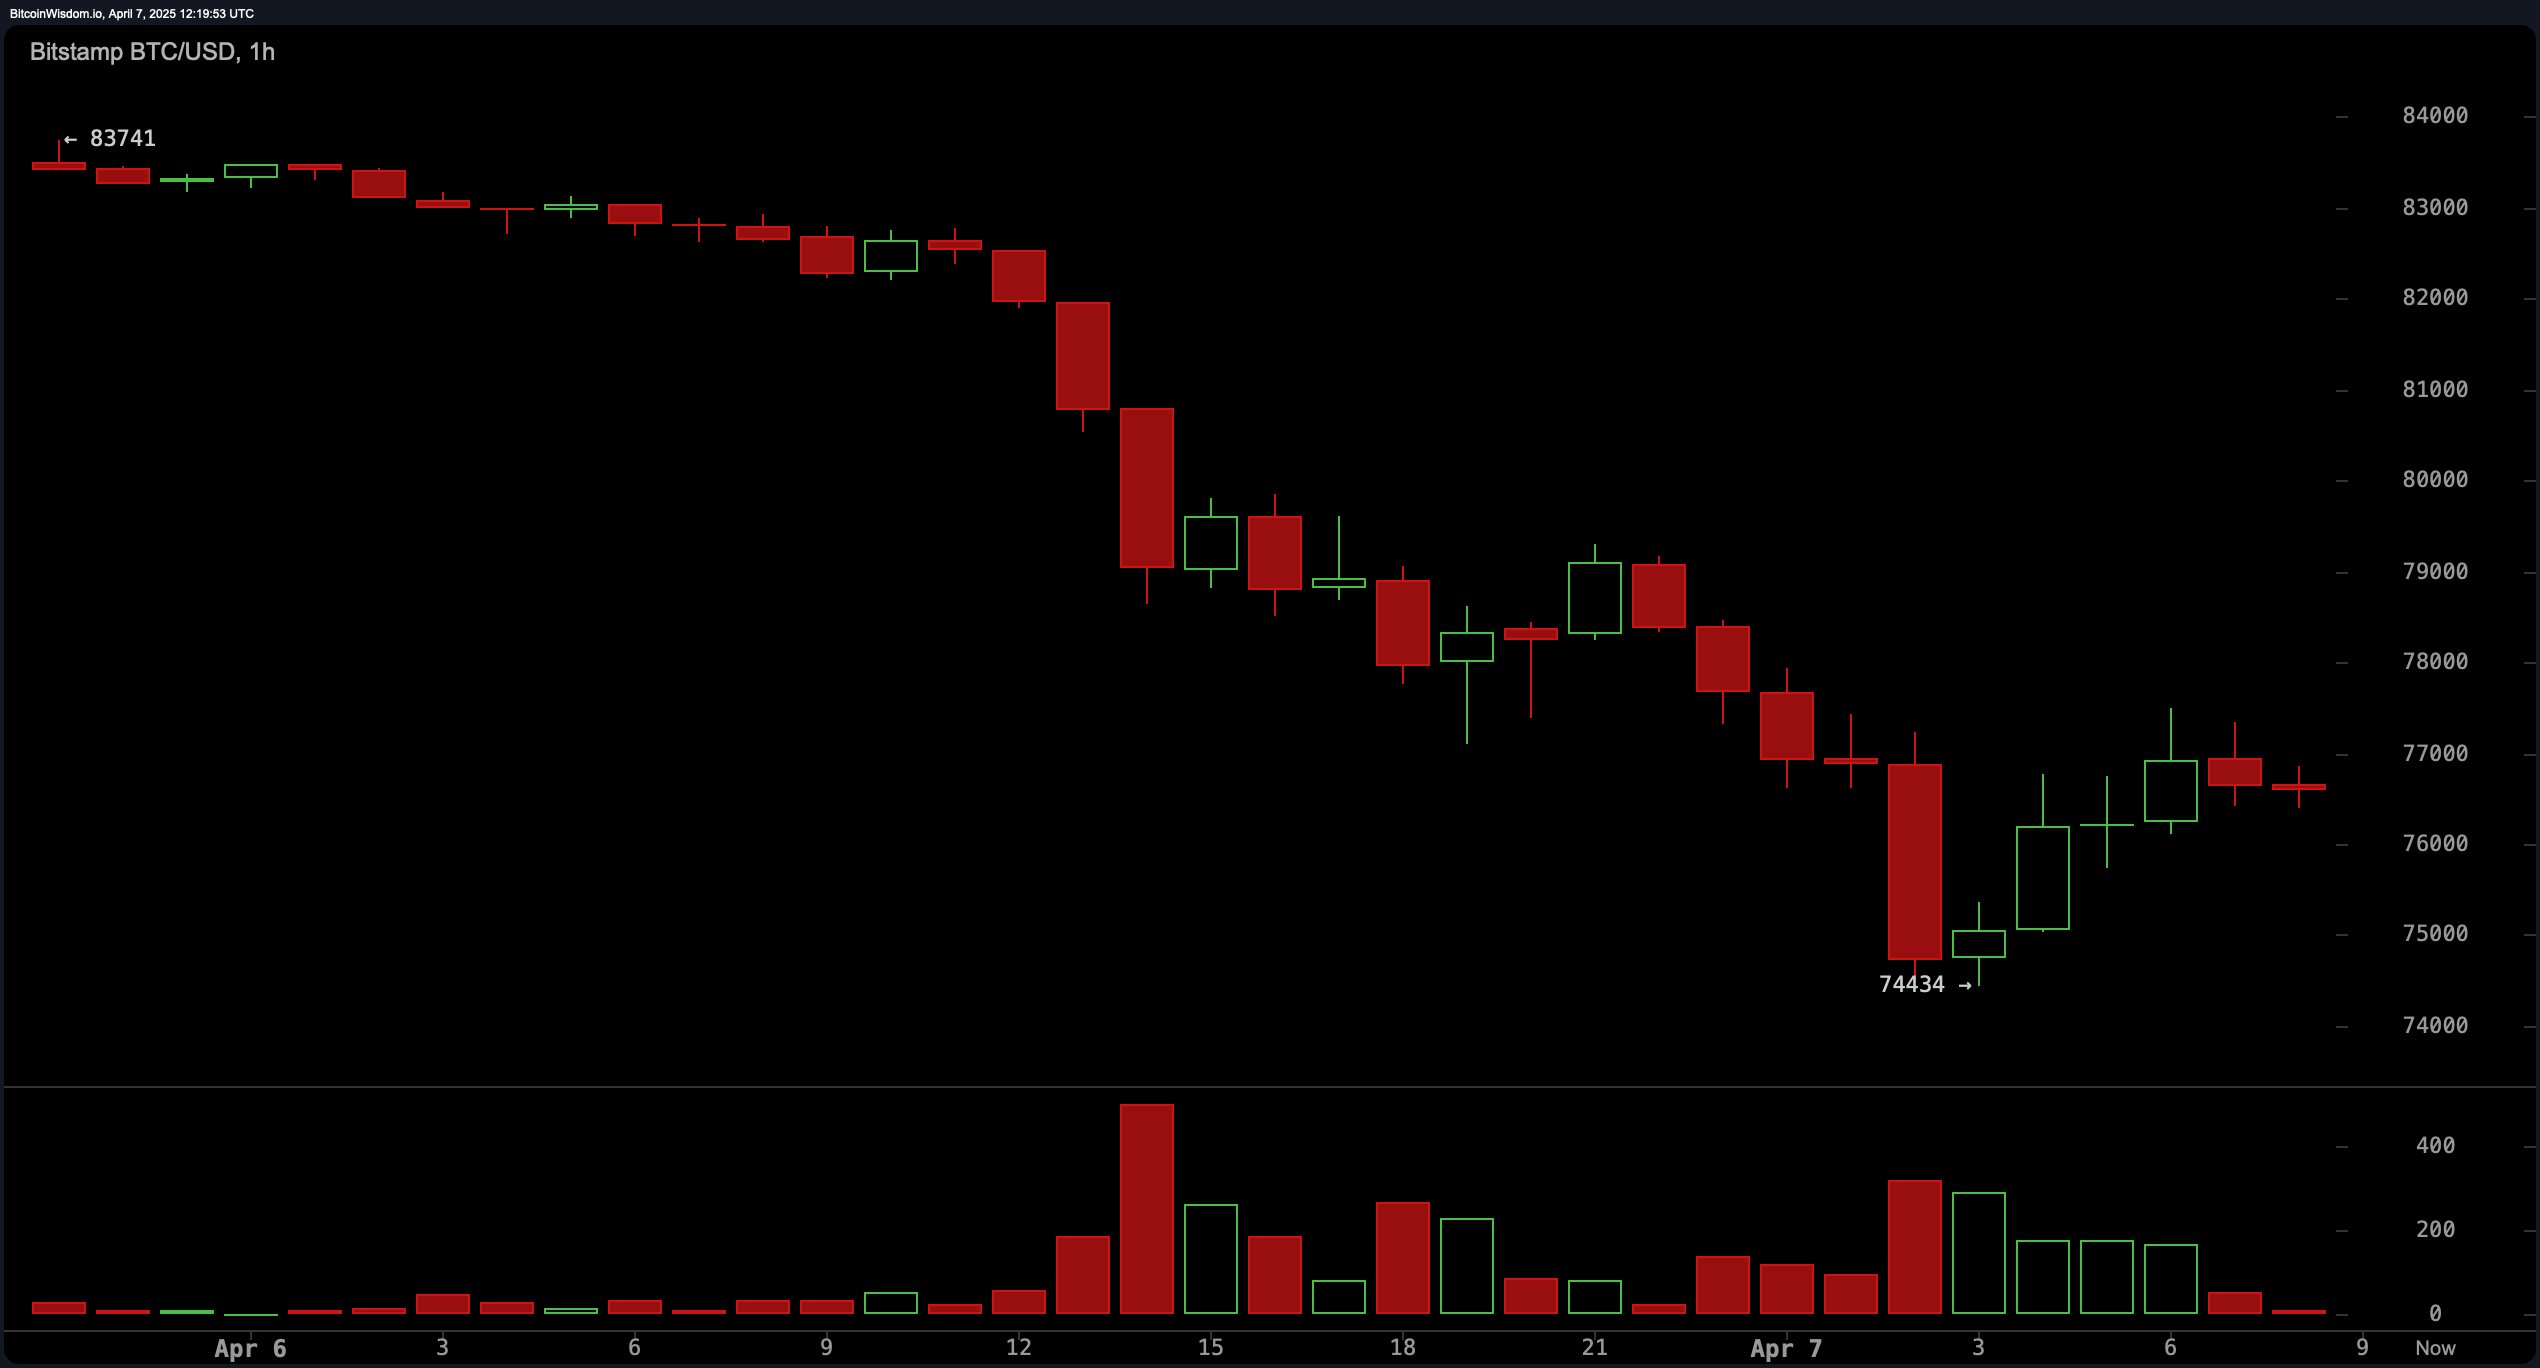
BTC/USD 1H chart via Bitstamp on April 7, 2025.
Oscillators offer mixed signals, with the relative strength index (RSI) at 33.9, stochastic at 19.2, and commodity channel index (CCI) at −265.6 — all in neutral territory, though pointing to potential oversold conditions. The momentum indicator registers −7,657.0, signaling a buy, while the moving average convergence divergence (MACD) level of −1,750.1 remains bearish with a sell indication. This divergence suggests a possible but unconfirmed reversal opportunity if downward momentum begins to ease.
The moving averages align closely with the bearish theme. Every key short- and long-term moving average — including the 10-period exponential moving average (EMA), 20-period EMA, 50-period simple moving average (SMA), and even the 200-period SMA — signals a bearish outlook. With bitcoin’s current price below all major moving averages, trend-following models suggest staying cautious on long positions unless a structural shift occurs. In summary, despite hints of an oversold bounce, prevailing technical signals favor bears in the near term.
Bull Verdict:
If bitcoin can hold support around the $74,000–$75,000 zone and print a clear reversal pattern with increasing volume, a recovery toward the $78,000–$79,000 resistance range becomes plausible. Oscillator data showing potential oversold conditions supports the likelihood of a short-term bounce, giving bulls a narrow window to reclaim momentum.
Bear Verdict:
With every major moving average aligned to the downside and volume confirming the bearish trend across all timeframes, bitcoin remains under sustained selling pressure. Unless price action decisively reclaims and holds above the $78,000–$80,000 resistance, bears retain control and could drive the price lower toward or below the $72,000 threshold.
免责声明:本文章仅代表作者个人观点,不代表本平台的立场和观点。本文章仅供信息分享,不构成对任何人的任何投资建议。用户与作者之间的任何争议,与本平台无关。如网页中刊载的文章或图片涉及侵权,请提供相关的权利证明和身份证明发送邮件到support@aicoin.com,本平台相关工作人员将会进行核查。

