
FARTCOIN Soars 250% in a Month But Bearish Pressure Might Return

FARTCOIN is cooling off after a parabolic rally, with indicators showing mixed signals. Here's what to watch as bulls aim for a breakout.
FARTCOIN has surged more than 40% in the last seven days and is up around 250% over the past 30 days, making it one of the top-performing assets among the largest meme coins.
The explosive rally has caught the attention of traders, but recent indicators suggest momentum may be shifting. While the uptrend remains intact, signs of cooling buying pressure are starting to emerge.
FARTCOIN BBTrend Shows Buying Pressure Could Be Easing
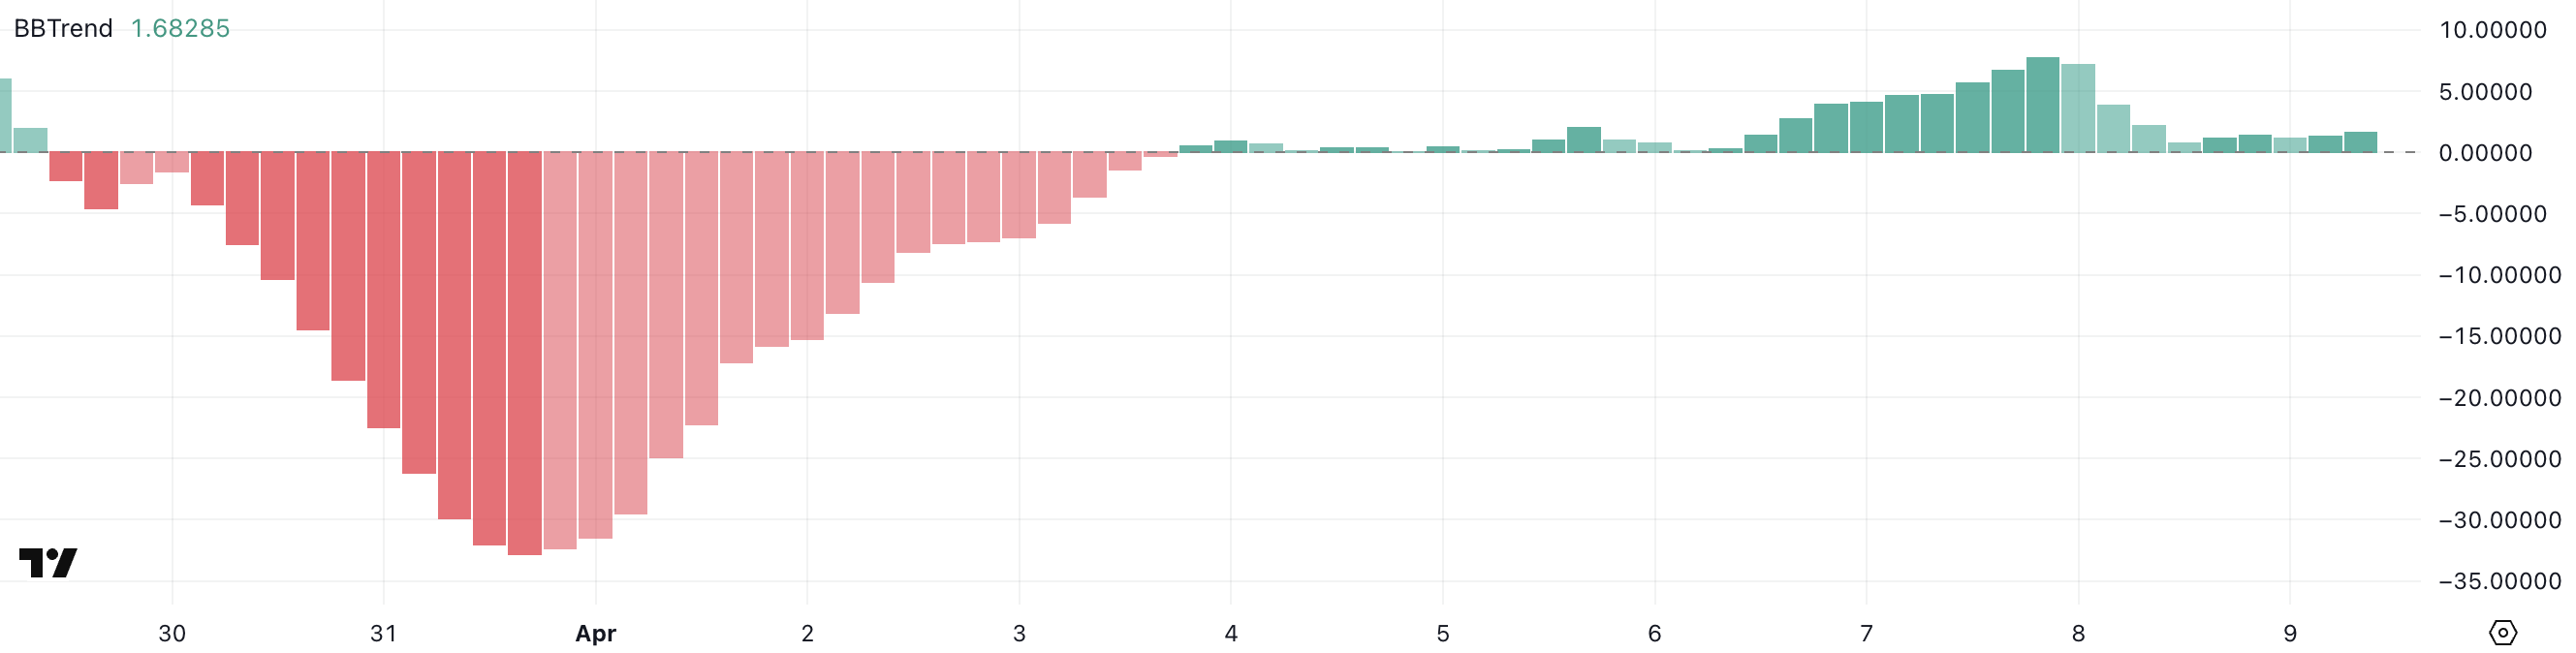
FARTCOIN’s BBTrend indicator is currently at 1.68, a sharp drop from 7.79 just two days ago, when the token experienced a nearly 43% price surge and became one of the top performers among meme coins.
This steep decline in BBTrend reflects a significant cooling in bullish momentum following the explosive rally.
While BBTrend values above zero still suggest upward pressure, the sharp drop signals that the trend is losing strength and that the recent hype may be fading.
 FARTCOIN BBTrend. Source:
TradingView.
FARTCOIN BBTrend. Source:
TradingView.
The BBTrend (Bollinger Band Trend) is a volatility-based indicator that gauges the strength and direction of a trend by analyzing price positioning relative to the Bollinger Bands.
Positive values indicate bullish momentum, while negative readings point to bearish momentum; the farther the number from zero, the stronger the trend.
With FARTCOIN’s BBTrend falling from elevated levels to near-flat territory, it suggests that price action is becoming more range-bound and potentially vulnerable to a pullback if buying interest doesn’t return soon.
FARTCOIN ADX Shows The Uptrend Is Still Here
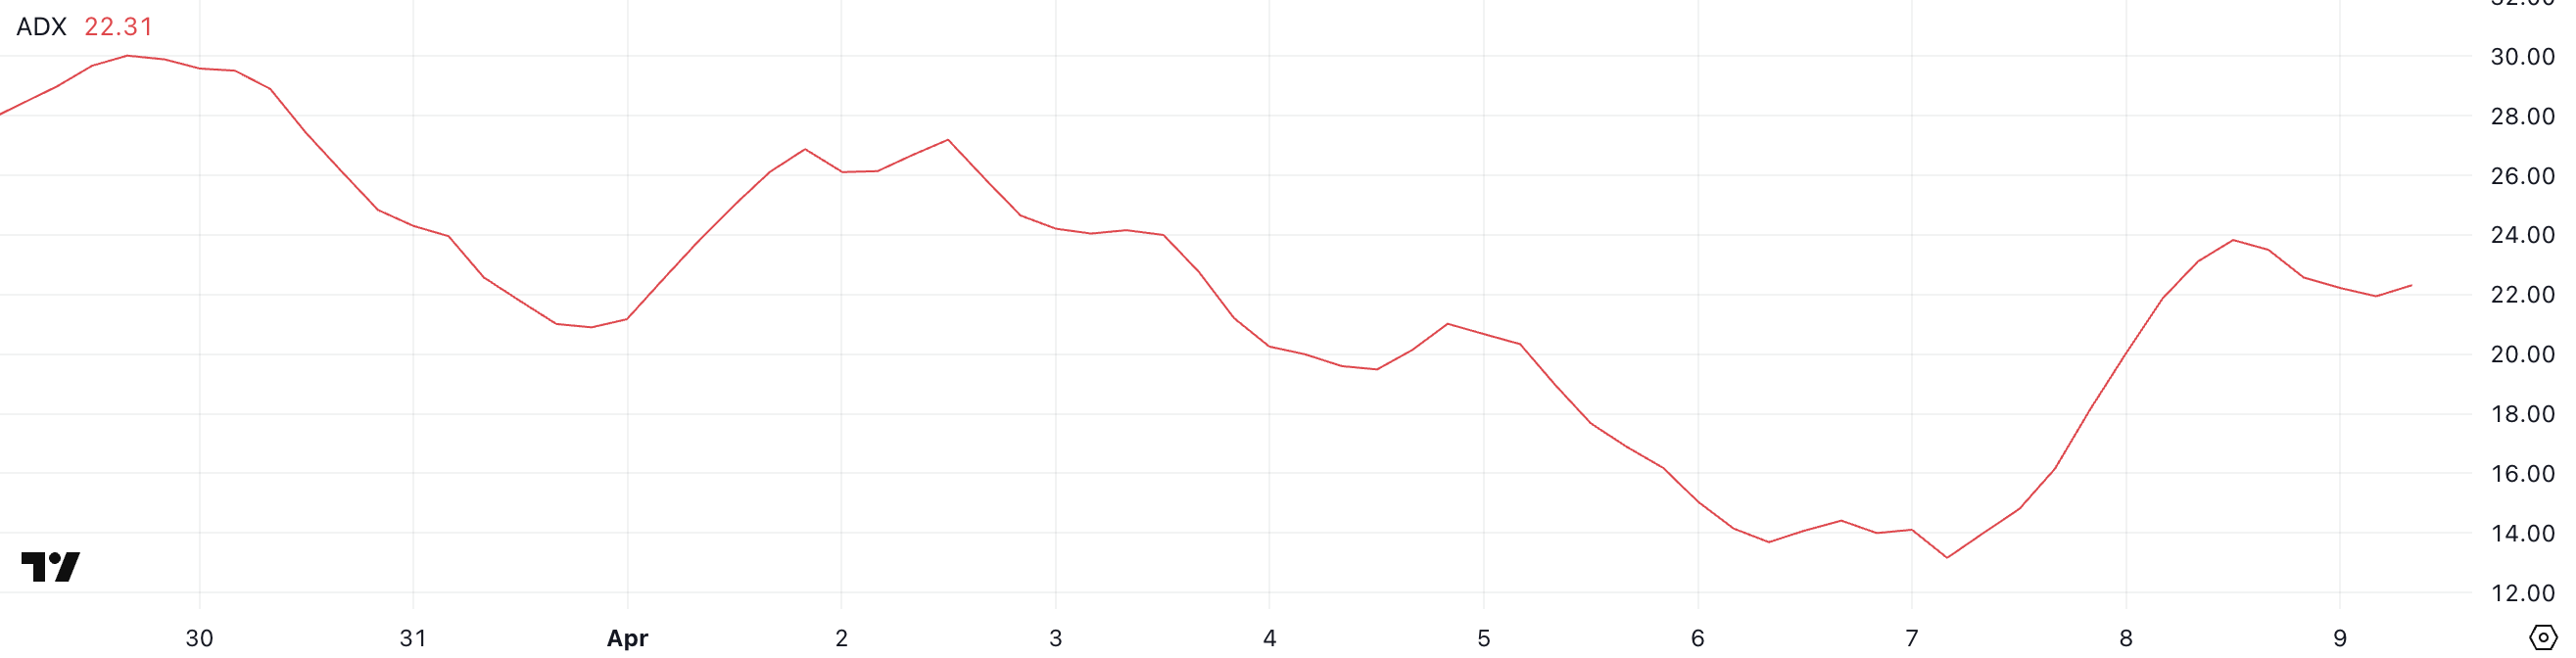
FARTCOIN’s ADX is currently at 22.31, up significantly from 13.16 just two days ago, though slightly below yesterday’s peak of 23.83.
This steady rise in the Average Directional Index suggests that the strength of FARTCOIN’s uptrend is building, even if momentum briefly peaked.
The move from a low-trend environment into the low-20s range indicates growing conviction behind the recent bullish move despite some near-term fluctuations.
 FARTCOIN ADX. Source:
TradingView.
FARTCOIN ADX. Source:
TradingView.
The ADX (Average Directional Index) is a widely used indicator that measures the strength of a trend, regardless of its direction.
Values below 20 typically signal a weak or non-existent trend, while values above 25 are associated with strong and sustained directional movement. With FARTCOIN’s ADX now climbing into the low-20s, it’s approaching the threshold where breakouts can gain traction.
If this trend strength continues to build, it could support further upside price action, but bulls will want to see the ADX push decisively above 25 to confirm momentum is strong enough to sustain the uptrend.
Will FARTCOIN Break Above $0.80?
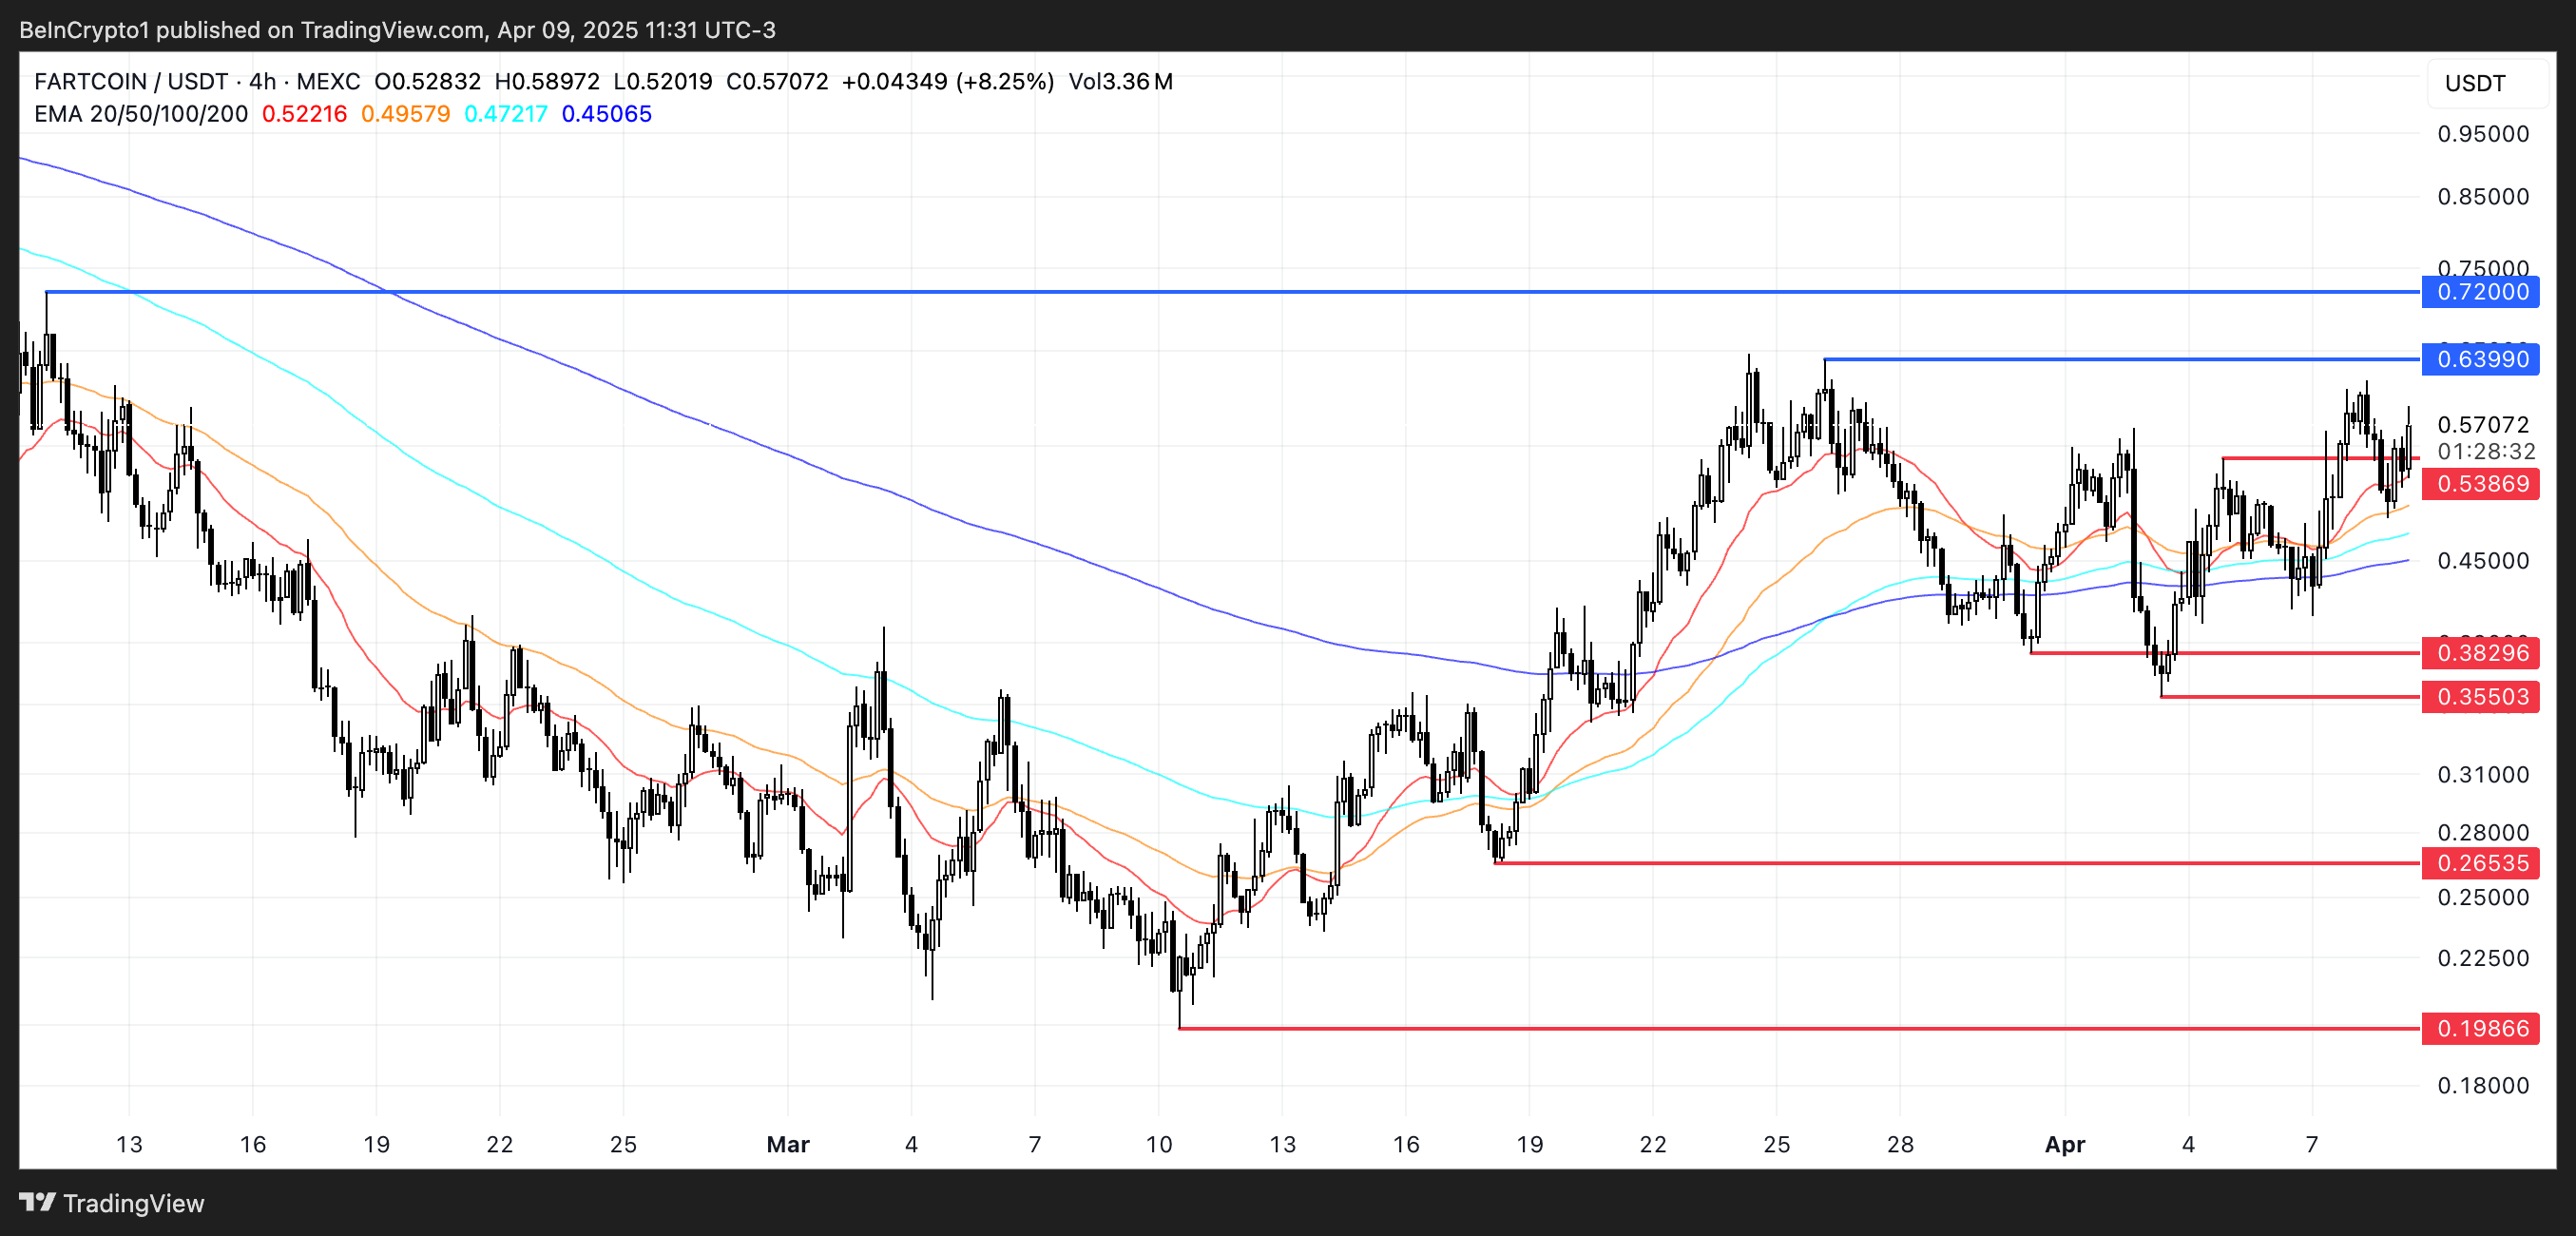
FARTCOIN price is currently riding an uptrend, and if bullish momentum holds, it could soon test resistance at $0.75.
A breakout above that level would be significant, potentially paving the way for a move toward $1 for the first time since February.
Such a breakout could attract renewed attention and volume, reinforcing the bullish case in the short term.
 FARTCOIN Price Analysis. Source:
TradingView.
FARTCOIN Price Analysis. Source:
TradingView.
However, the uptrend remains fragile, especially as meme coins sector has been struggling in the last months.
If FARTCOIN loses steam and slips below immediate support at $0.538, it could quickly descend to test the next critical zones at $0.38 and $0.35—two tightly packed support levels that may provide temporary relief.
Should both fail to hold, the selloff could accelerate toward $0.26 and even $0.19, though such a move would likely require a steep and sustained bearish reversal.
Disclaimer: The content of this article solely reflects the author's opinion and does not represent the platform in any capacity. This article is not intended to serve as a reference for making investment decisions.
You may also like
New spot margin trading pair — HOLO/USDT!
FUN drops by 32.34% within 24 hours as it faces a steep short-term downturn
- FUN plunged 32.34% in 24 hours to $0.008938, marking a 541.8% monthly loss amid prolonged bearish trends. - Technical breakdowns, elevated selling pressure, and forced liquidations highlight deteriorating market sentiment and risk-off behavior. - Analysts identify key support below $0.0080 as critical, with bearish momentum confirmed by RSI (<30) and MACD indicators. - A trend-following backtest strategy proposes short positions based on technical signals to capitalize on extended downward trajectories.

OPEN has dropped by 189.51% within 24 hours during a significant market pullback
- OPEN's price plummeted 189.51% in 24 hours to $0.8907, marking its largest intraday decline in history. - The token fell 3793.63% over 7 days, matching identical monthly and yearly declines, signaling severe bearish momentum. - Technical analysts cite broken support levels and lack of bullish catalysts as key drivers of the sustained sell-off. - Absence of stabilizing volume or reversal patterns leaves the market vulnerable to further downward pressure.

New spot margin trading pair — LINEA/USDT!