Bitget App
Trade smarter
Buy cryptoMarketsTradeFuturesEarnWeb3SquareMore
Trade
Spot
Buy and sell crypto with ease
Margin
Amplify your capital and maximize fund efficiency
Onchain
Going Onchain, without going Onchain!
Convert & block trade
Convert crypto with one click and zero fees
Explore
Launchhub
Gain the edge early and start winning
Copy
Copy elite trader with one click
Bots
Simple, fast, and reliable AI trading bot
Trade
USDT-M Futures
Futures settled in USDT
USDC-M Futures
Futures settled in USDC
Coin-M Futures
Futures settled in cryptocurrencies
Explore
Futures guide
A beginner-to-advanced journey in futures trading
Futures promotions
Generous rewards await
Overview
A variety of products to grow your assets
Simple Earn
Deposit and withdraw anytime to earn flexible returns with zero risk
On-chain Earn
Earn profits daily without risking principal
Structured Earn
Robust financial innovation to navigate market swings
VIP and Wealth Management
Premium services for smart wealth management
Loans
Flexible borrowing with high fund security
AAVE and UNI Approaching Key Resistance – Will Breakouts Trigger a Recovery?

AAVE and UNI Approaching Key Resistance – Will Breakouts Trigger a Recovery?

CoinsProbeCoinsProbe2025/04/13 07:00
By:Nilesh Hembade

Date: Sat, April 12, 2025 | 05:30 PM GMT

The crypto market just wrapped up one of its toughest quarters in recent years. Ethereum (ETH) dropped 45%—its worst Q1 since 2018—and the ripple effect hit altcoins hard. DeFi giants like Aave (AAVE) and Uniswap (UNI) both saw over half their value erased in just a few months.

But after weeks of bleeding, there are early signs of life. Both AAVE and UNI are starting to form bullish reversal patterns on the charts, and they’re now approaching major resistance levels that could define their next move.

AAVE and UNI Approaching Key Resistance – Will Breakouts Trigger a Recovery? image 0 
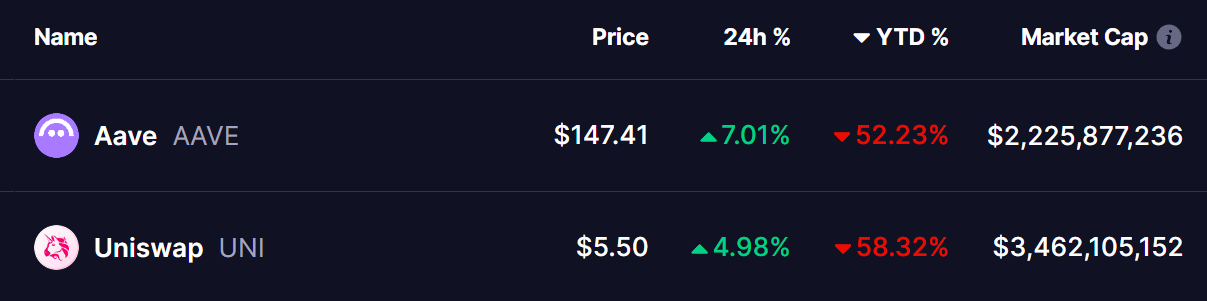
Source: Coinmarketcap

Aave (AAVE)

AAVE has been trading within a falling wedge pattern since rejecting the $400 level back in mid-December. The sell-off was sharp—more than 70%—bottoming out near $113 on April 7. That level attracted strong demand, with the price bouncing back to $147 in recent days.

AAVE and UNI Approaching Key Resistance – Will Breakouts Trigger a Recovery? image 1 
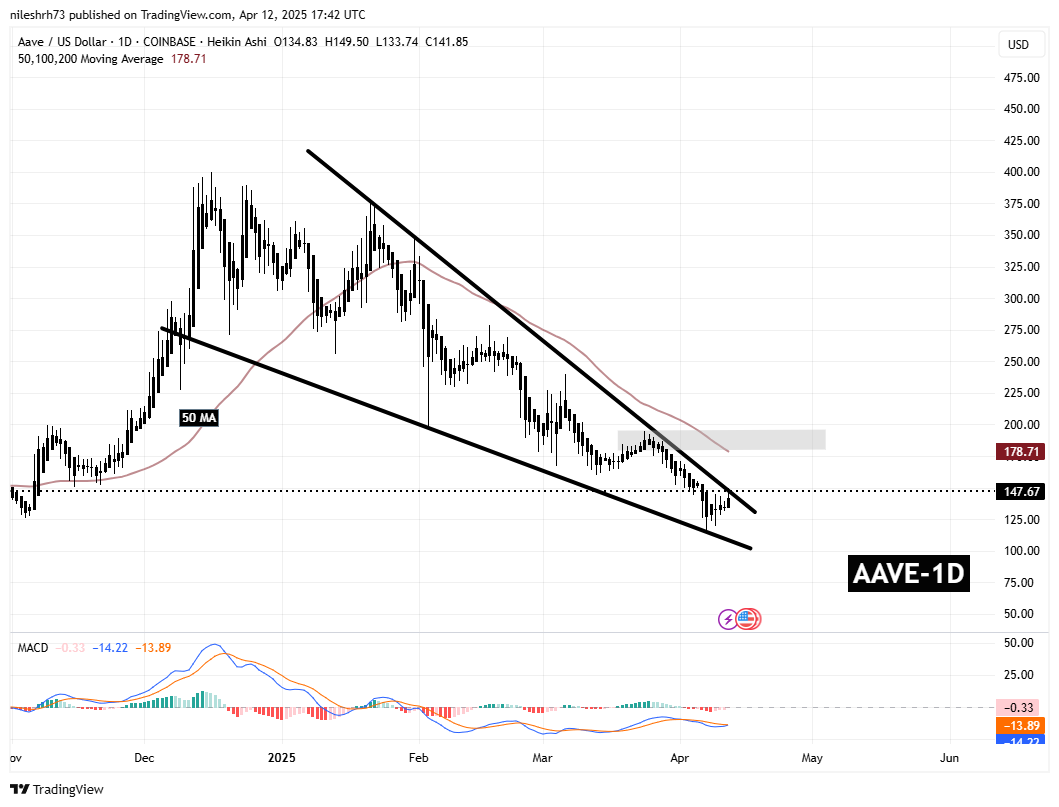
Aave (AAVE) Daily Chart/Coinsprobe (Source: Tradingview)

Now, AAVE is pushing up against the wedge’s upper boundary. If it breaks out and confirms with a retest, the next major target lies near the $194 zone and the 50-day moving average. That’s about 30% upside from where things stand today.

Uniswap (UNI)

UNI’s chart is nearly a mirror of AAVE’s. After topping at $19.44 in early December, UNI slid more than 77%, hitting a low of $4.61 on April 7. Since then, it’s recovered to $5.53 and is pressing against the top of its own falling wedge.

AAVE and UNI Approaching Key Resistance – Will Breakouts Trigger a Recovery? image 2 
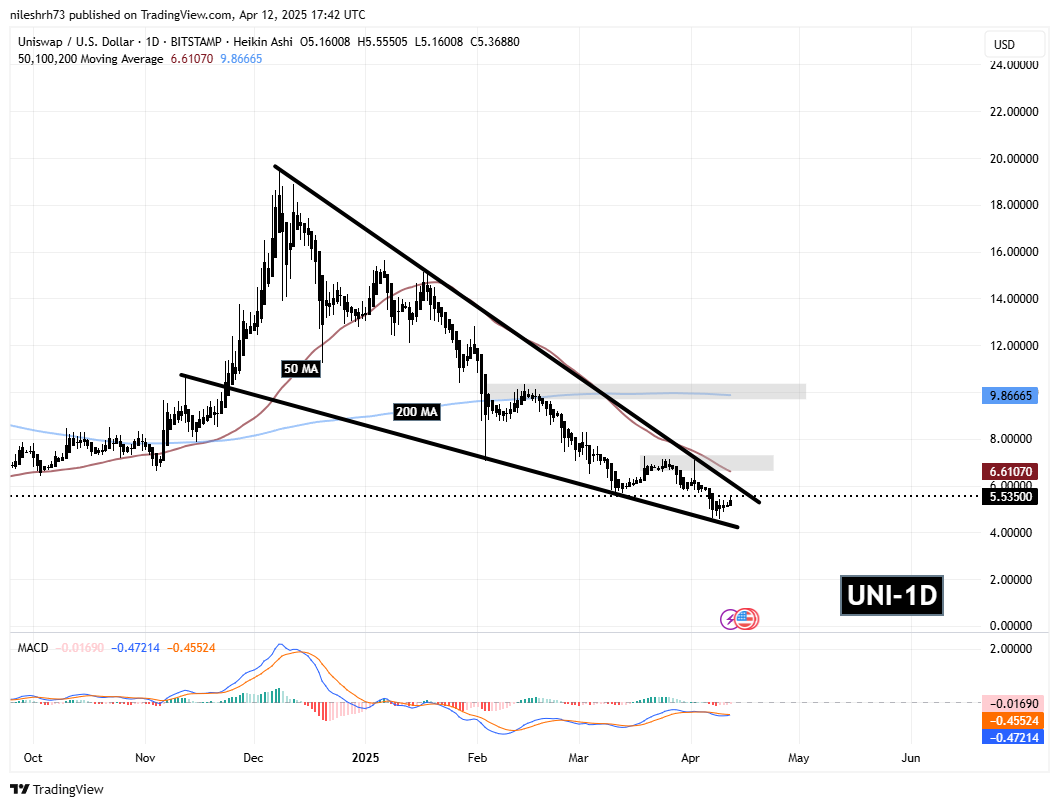
Uniswap (UNI) Daily Chart/Coinsprobe (Source: Tradingview)

A confirmed breakout here could propel UNI toward the $7.27 region, which lines up with its 50-day moving average. That would mark a solid 31% move higher from current levels.

What’s the Bigger Picture?

These wedge patterns on both AAVE and UNI are classic signs that bearish momentum might be fading. Add in rising volume and improving MACD indicators, and the setup for potential breakouts is clear.

But traders should stay cautious—if these resistance levels reject the move, both tokens could slip back into consolidation or even revisit recent lows.

Disclaimer: This article is for informational purposes only and not financial advice. Always do your own research before making any investment decisions.

0

Disclaimer: The content of this article solely reflects the author's opinion and does not represent the platform in any capacity. This article is not intended to serve as a reference for making investment decisions.

PoolX: Earn new token airdrops
Lock your assets and earn 10%+ APR
Lock now!

You may also like

New spot margin trading pair — HOLO/USDT!

Bitget Announcement2025/09/12 07:46

FUN drops by 32.34% within 24 hours as it faces a steep short-term downturn

- FUN plunged 32.34% in 24 hours to $0.008938, marking a 541.8% monthly loss amid prolonged bearish trends. - Technical breakdowns, elevated selling pressure, and forced liquidations highlight deteriorating market sentiment and risk-off behavior. - Analysts identify key support below $0.0080 as critical, with bearish momentum confirmed by RSI (<30) and MACD indicators. - A trend-following backtest strategy proposes short positions based on technical signals to capitalize on extended downward trajectories.

Bitget-RWA2025/09/12 06:14
FUN drops by 32.34% within 24 hours as it faces a steep short-term downturn

OPEN has dropped by 189.51% within 24 hours during a significant market pullback

- OPEN's price plummeted 189.51% in 24 hours to $0.8907, marking its largest intraday decline in history. - The token fell 3793.63% over 7 days, matching identical monthly and yearly declines, signaling severe bearish momentum. - Technical analysts cite broken support levels and lack of bullish catalysts as key drivers of the sustained sell-off. - Absence of stabilizing volume or reversal patterns leaves the market vulnerable to further downward pressure.

Bitget-RWA2025/09/12 06:14
OPEN has dropped by 189.51% within 24 hours during a significant market pullback

New spot margin trading pair — LINEA/USDT!

Bitget Announcement2025/09/11 10:04