Bitget App
Trade smarter
Buy cryptoMarketsTradeFuturesEarnWeb3SquareMore
Trade
Spot
Buy and sell crypto with ease
Margin
Amplify your capital and maximize fund efficiency
Onchain
Going Onchain, without going Onchain!
Convert & block trade
Convert crypto with one click and zero fees
Explore
Launchhub
Gain the edge early and start winning
Copy
Copy elite trader with one click
Bots
Simple, fast, and reliable AI trading bot
Trade
USDT-M Futures
Futures settled in USDT
USDC-M Futures
Futures settled in USDC
Coin-M Futures
Futures settled in cryptocurrencies
Explore
Futures guide
A beginner-to-advanced journey in futures trading
Futures promotions
Generous rewards await
Overview
A variety of products to grow your assets
Simple Earn
Deposit and withdraw anytime to earn flexible returns with zero risk
On-chain Earn
Earn profits daily without risking principal
Structured Earn
Robust financial innovation to navigate market swings
VIP and Wealth Management
Premium services for smart wealth management
Loans
Flexible borrowing with high fund security
Curve DAO Token (CRV) Gains Momentum Following Key Breakout – Will Raydium (RAY) Follow the Same Path?

Curve DAO Token (CRV) Gains Momentum Following Key Breakout – Will Raydium (RAY) Follow the Same Path?

CoinsProbeCoinsProbe2025/04/13 07:00
By:Nilesh Hembade

Date: Sun, April 13, 2025 | 06:10 AM GMT

After facing the blow of “Black Monday,” this week, the cryptocurrency market is finally showing signs of positive momentum. This rebound is largely attributed to U.S. President Trump’s move to pause tariffs for 90 days — a decision that’s injecting fresh optimism into the market.

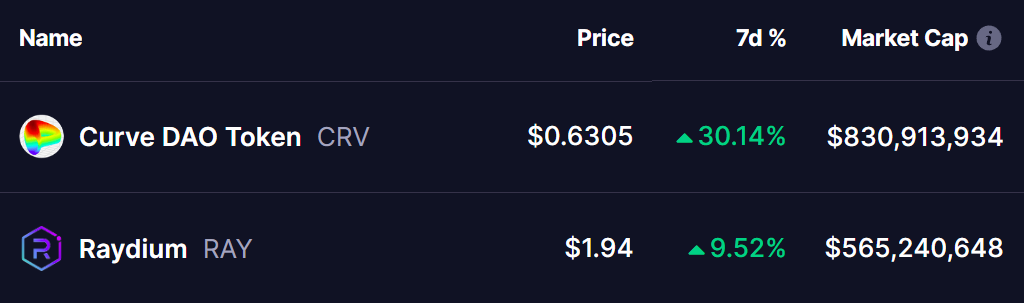
One of the standout performers during this turnaround is Curve DAO Token (CRV), which has surged an impressive 30% over the last week. Meanwhile, Raydium (RAY) is also starting to shine with a 9% gain, and its chart suggests that it might just be gearing up to follow CRV’s path.

Curve DAO Token (CRV) Gains Momentum Following Key Breakout – Will Raydium (RAY) Follow the Same Path? image 0 Source: Coinmarketcap

CRV and RAY Analysis: Inverse Head and Shoulders in Play?

Looking at the left side of the chart, CRV has clearly broken out of a classic inverse head and shoulders formation — a pattern typically associated with bullish reversals. After reclaiming the neckline at $0.58, CRV is now trading at around $0.63. A brief retest of the breakout zone might occur, but if momentum holds, the next resistance lies near $0.83, which represents a potential 32% upside from current levels.

CRV and RAY Tokens Chart Comparison/Coinsprobe (Source: Tradingview)

On the right side, Raydium (RAY) is seemingly one step behind but may not be far from its own breakout. The token is forming the right shoulder of a similar inverse head and shoulders setup. It might dip slightly toward the $1.64 mark — aligning with its 50-day moving average — before mounting a challenge at the neckline.

If RAY breaks out above the $2.10 neckline after completing the pattern, the next major target sits at $2.31, and potentially beyond that as broader sentiment continues to improve.

What’s Next?

If market optimism sustains and both CRV and RAY follow through on these bullish technical structures, we could be looking at the beginning of a larger recovery trend. For traders, CRV’s confirmed breakout could act as a blueprint to watch RAY closely for a similar move.

Disclaimer: This article is for informational purposes only and not financial advice. Always conduct your own research before investing in cryptocurrencies.

0

Disclaimer: The content of this article solely reflects the author's opinion and does not represent the platform in any capacity. This article is not intended to serve as a reference for making investment decisions.

PoolX: Earn new token airdrops
Lock your assets and earn 10%+ APR
Lock now!

You may also like

New spot margin trading pair — HOLO/USDT!

Bitget Announcement2025/09/12 07:46

FUN drops by 32.34% within 24 hours as it faces a steep short-term downturn

- FUN plunged 32.34% in 24 hours to $0.008938, marking a 541.8% monthly loss amid prolonged bearish trends. - Technical breakdowns, elevated selling pressure, and forced liquidations highlight deteriorating market sentiment and risk-off behavior. - Analysts identify key support below $0.0080 as critical, with bearish momentum confirmed by RSI (<30) and MACD indicators. - A trend-following backtest strategy proposes short positions based on technical signals to capitalize on extended downward trajectories.

Bitget-RWA2025/09/12 06:14
FUN drops by 32.34% within 24 hours as it faces a steep short-term downturn

OPEN has dropped by 189.51% within 24 hours during a significant market pullback

- OPEN's price plummeted 189.51% in 24 hours to $0.8907, marking its largest intraday decline in history. - The token fell 3793.63% over 7 days, matching identical monthly and yearly declines, signaling severe bearish momentum. - Technical analysts cite broken support levels and lack of bullish catalysts as key drivers of the sustained sell-off. - Absence of stabilizing volume or reversal patterns leaves the market vulnerable to further downward pressure.

Bitget-RWA2025/09/12 06:14
OPEN has dropped by 189.51% within 24 hours during a significant market pullback

New spot margin trading pair — LINEA/USDT!

Bitget Announcement2025/09/11 10:04