
On-Chain Indicator Suggests Ethereum (ETH) Could Be Undervalued, According to Crypto Analyst

An on-chain indicator suggests that top smart contract protocol Ethereum ( ETH ) could currently be undervalued, according to a popular crypto analyst.
Trader Ali Martinez tells his 135,100 followers on the social media platform X that ETH’s Entity-Adjusted Dormancy Flow just dropped below one million, suggesting that Ethereum may be in the midst of carving a major cycle bottom.
“This historically indicates a macro bottom zone, meaning ETH might be undervalued and long-term holders are less inclined to sell. It also suggests:
• Sentiment is low
• Capitulation may have occurred
• Smart money might be accumulating”
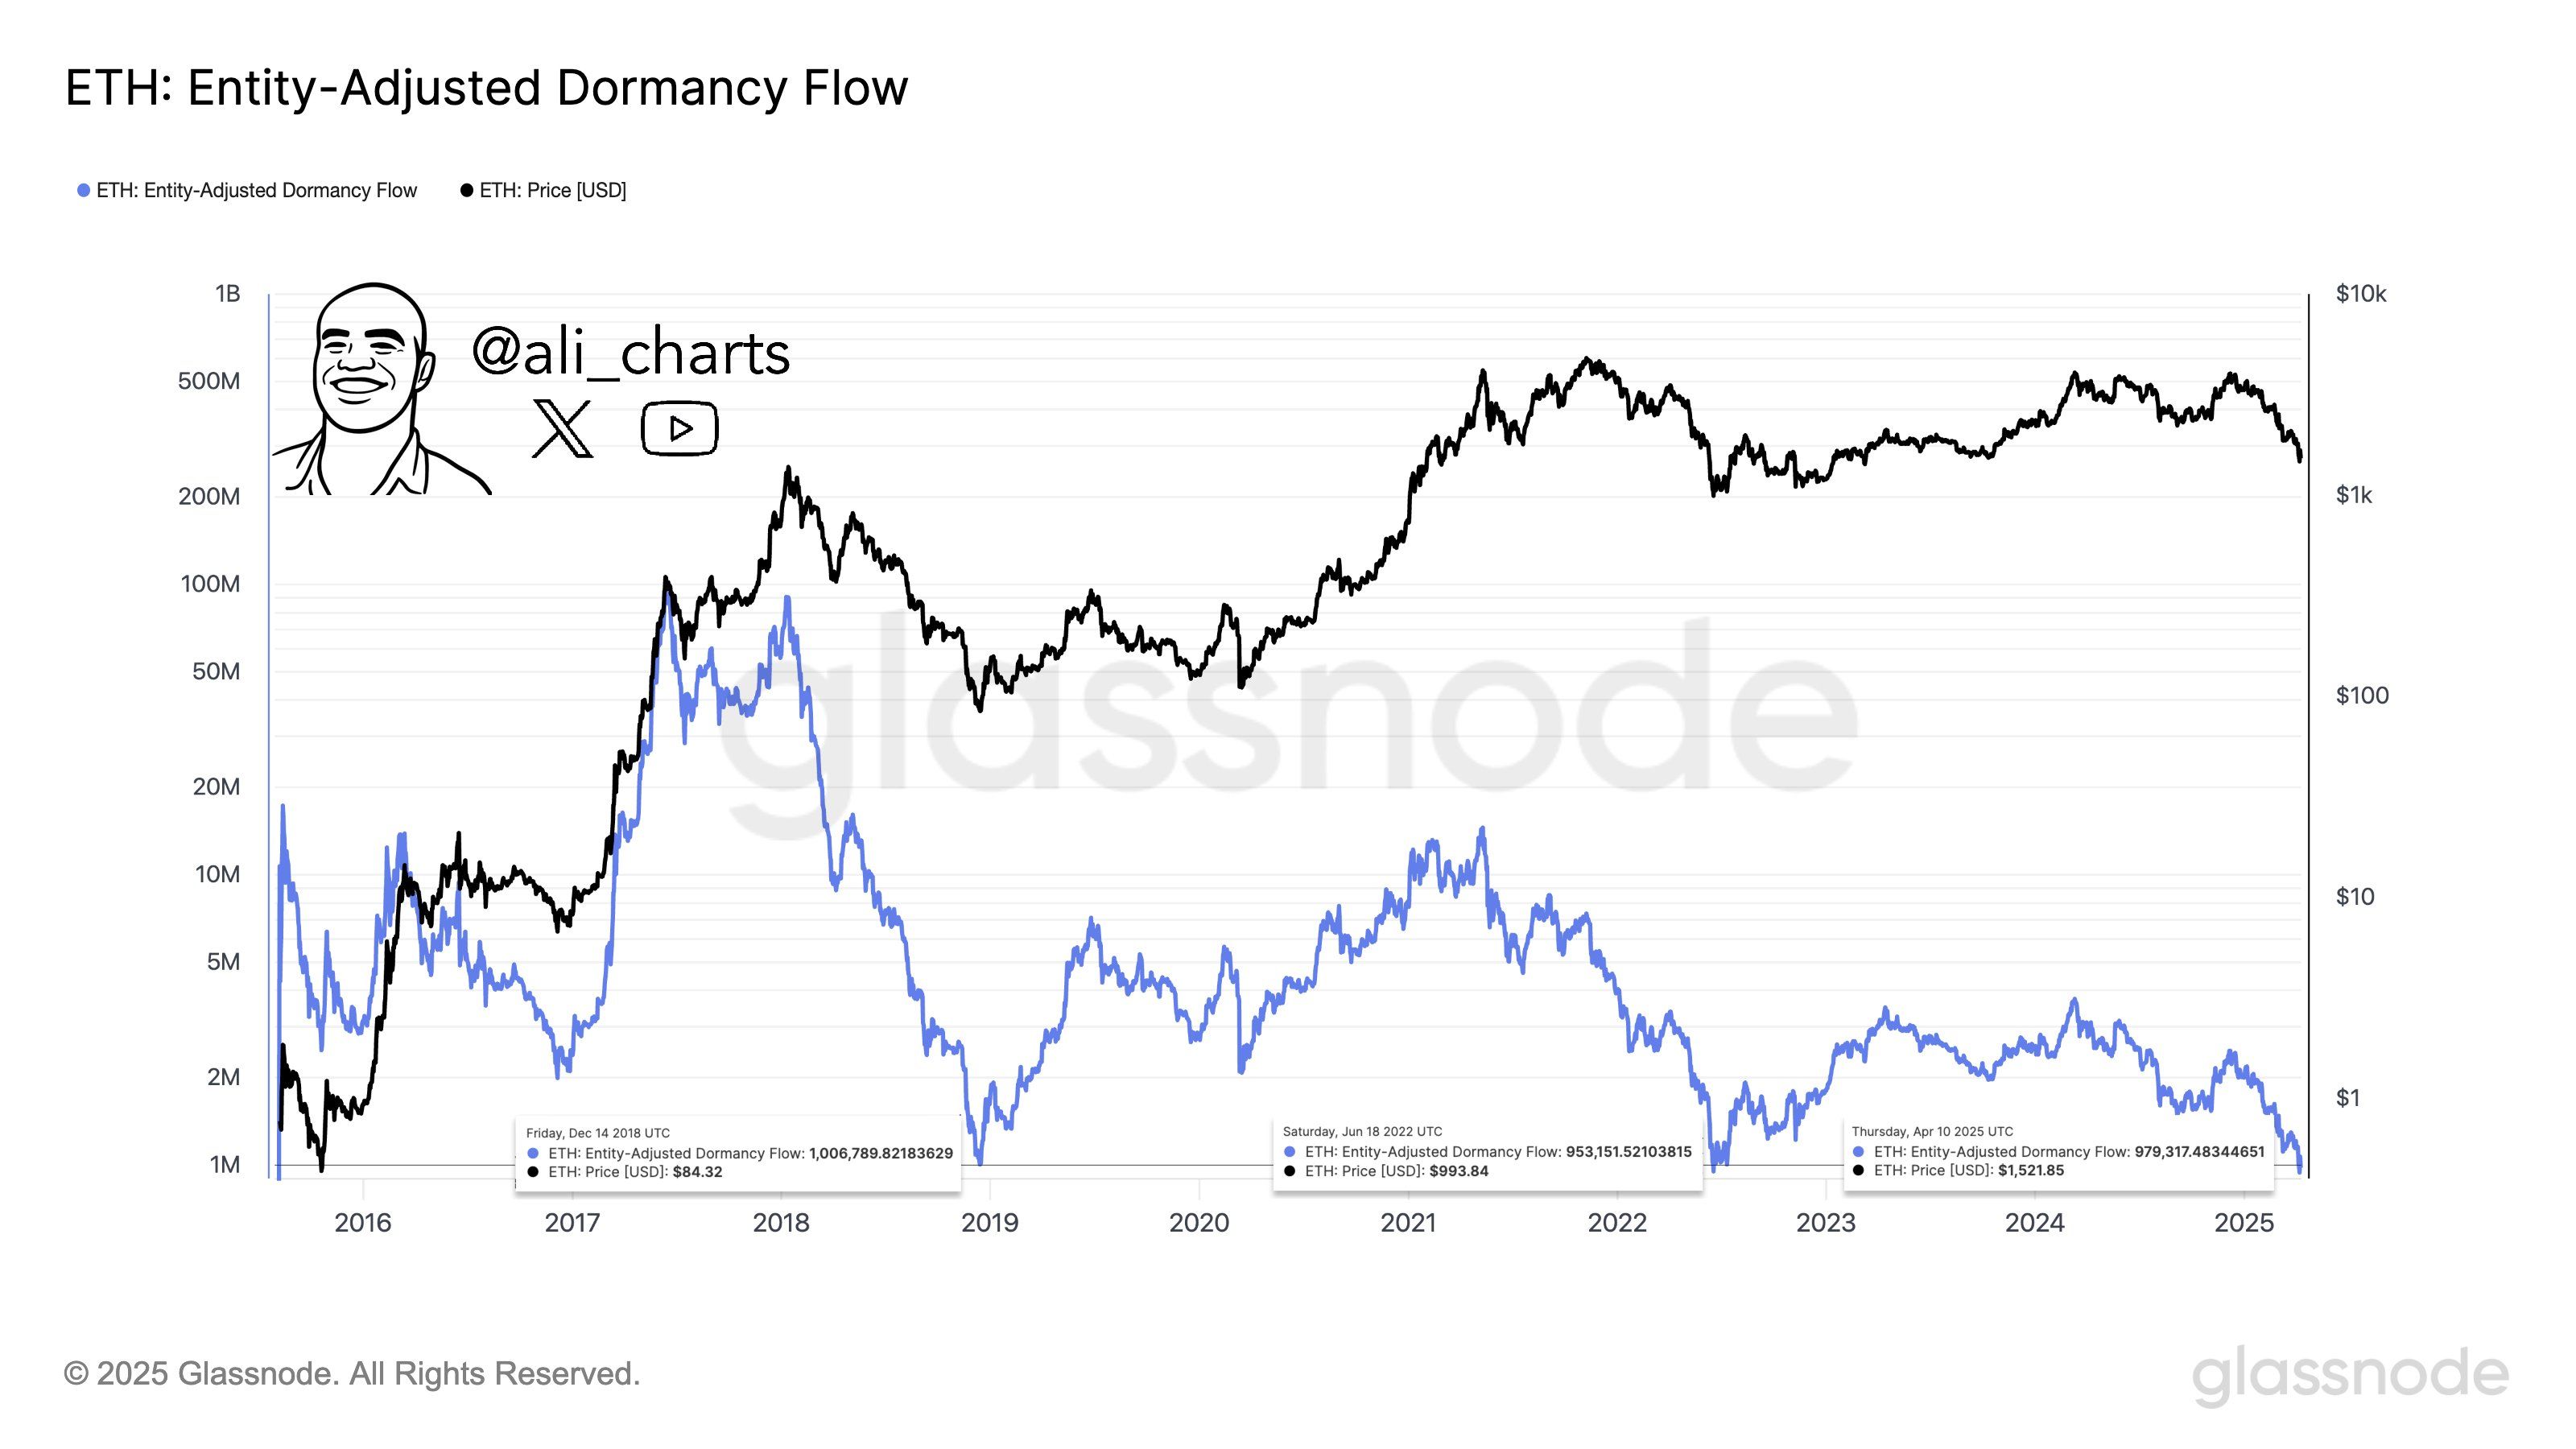 Source: Ali Martinez/X
Entity-Adjusted Dormancy Flow is used “to time market lows and assess whether the bull market remains in relatively normal conditions,” according to the crypto analytics firm Glassnode . The metric, which Glassnode says helps clarify whether an asset is in a bullish or bearish primary trend, measures the ratio of a coin’s market cap and its annualized dormancy value tracked in US dollars.
Martinez also notes that 453,000 Ethereum have been withdrawn from crypto exchanges in the past five days.
 Source: Ali Martinez/X
Large amounts of ETH flowing out from exchanges can serve as a bullish indicator as deep-pocketed investors accumulate the asset.
ETH is trading at $1,558 at time of writing, up over 2% in the last 24 hours.
Follow us on X , Facebook and Telegram
Don't Miss a Beat – Subscribe to get email alerts delivered directly to your inbox
Check Price Action
Surf The Daily Hodl Mix
Generated Image: Midjourney
Disclaimer: The content of this article solely reflects the author's opinion and does not represent the platform in any capacity. This article is not intended to serve as a reference for making investment decisions.
You may also like
New spot margin trading pair — HOLO/USDT!
FUN drops by 32.34% within 24 hours as it faces a steep short-term downturn
- FUN plunged 32.34% in 24 hours to $0.008938, marking a 541.8% monthly loss amid prolonged bearish trends. - Technical breakdowns, elevated selling pressure, and forced liquidations highlight deteriorating market sentiment and risk-off behavior. - Analysts identify key support below $0.0080 as critical, with bearish momentum confirmed by RSI (<30) and MACD indicators. - A trend-following backtest strategy proposes short positions based on technical signals to capitalize on extended downward trajectories.

OPEN has dropped by 189.51% within 24 hours during a significant market pullback
- OPEN's price plummeted 189.51% in 24 hours to $0.8907, marking its largest intraday decline in history. - The token fell 3793.63% over 7 days, matching identical monthly and yearly declines, signaling severe bearish momentum. - Technical analysts cite broken support levels and lack of bullish catalysts as key drivers of the sustained sell-off. - Absence of stabilizing volume or reversal patterns leaves the market vulnerable to further downward pressure.

New spot margin trading pair — LINEA/USDT!