
Ethereum Poised To Break Resistance And Reach New Highs

A rare graphic figure is forming on Ethereum, attracting the attention of crypto analysts. If confirmed, this configuration could trigger a strong bullish movement, with a price target around 3,360 dollars in the coming days.

Ethereum: a bullish signal well known to traders
While Ethereum is currently experiencing a 95% drop in blob fees that threatens its future, an inverted pattern is forming. Called inverse head and shoulders (H&S), it is a reversal figure. This pattern forms after a period of consolidation and anticipates a change in direction of the crypto market. In the case of Ethereum, the current configuration clearly shows a left shoulder, a lower head, followed by a right shoulder, with a neck line serving as a key resistance (rest assured, we are still talking about crypto).
To validate this bullish scenario, Ethereum will need to cross this neck line, often represented in yellow as shown in the crypto chart below. A sharp break of this level could trigger a wave of buying, fueled by increasing bullish pressure.
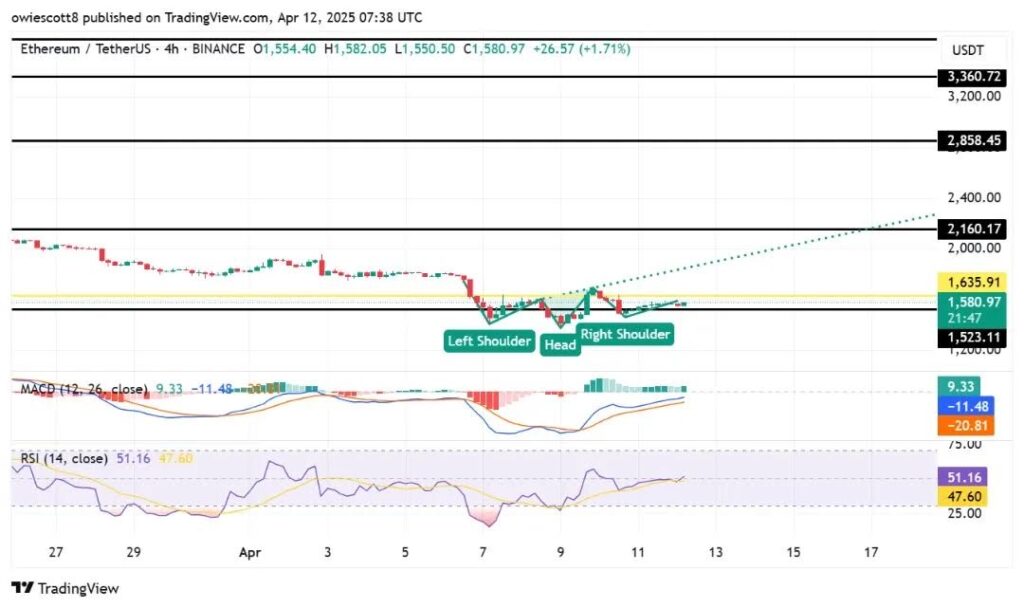 Head and shoulders (H&S) figure of Ethereum
Key levels and technical indicators
Several technical indicators reinforce this hypothesis. The RSI (Relative Strength Index) remains in neutral territory, offering room for upward movement without entering overbought territory. Meanwhile, the MACD shows signs of positive convergence, indicating a resurgence in momentum for Ethereum.
In the case of a breakout confirmation, Ethereum will then face several resistances. The first important level is around 2,160 dollars, followed by 2,858 dollars, an area historically marked by strong selling pressure. A break of these thresholds could propel ETH towards 3,360 dollars, corresponding to a former major peak. Furthermore, the Pectra update scheduled for May 7, 2025, could further intensify market volatility and positively influence ETH’s price.
Investors are closely monitoring this configuration, ready to act in case of a signal confirmation. If the volume supports the break of key resistances, Ethereum could regain a sustainable bullish momentum. In this context, ETH could once again become one of the best-performing assets in the crypto market in the short term.
Disclaimer: The content of this article solely reflects the author's opinion and does not represent the platform in any capacity. This article is not intended to serve as a reference for making investment decisions.
You may also like
CandyBomb x RAVE: Trade futures to share 200,000 RAVE!
Bitget TradFi: Trade gold, forex, and more assets in one account
CandyBomb x US: Trade to share 5,400,000 US
[Initial Listing] Bitget to list Almanak (ALMANAK). Grab a share of 4,200,000 ALMANAK