Bitget App
Trade smarter
Buy cryptoMarketsTradeFuturesEarnWeb3SquareMore
Trade
Spot
Buy and sell crypto with ease
Margin
Amplify your capital and maximize fund efficiency
Onchain
Going Onchain, without going Onchain!
Convert & block trade
Convert crypto with one click and zero fees
Explore
Launchhub
Gain the edge early and start winning
Copy
Copy elite trader with one click
Bots
Simple, fast, and reliable AI trading bot
Trade
USDT-M Futures
Futures settled in USDT
USDC-M Futures
Futures settled in USDC
Coin-M Futures
Futures settled in cryptocurrencies
Explore
Futures guide
A beginner-to-advanced journey in futures trading
Futures promotions
Generous rewards await
Overview
A variety of products to grow your assets
Simple Earn
Deposit and withdraw anytime to earn flexible returns with zero risk
On-chain Earn
Earn profits daily without risking principal
Structured Earn
Robust financial innovation to navigate market swings
VIP and Wealth Management
Premium services for smart wealth management
Loans
Flexible borrowing with high fund security
SHIB Army Watches Closely: Descending Triangle Nears Apex

SHIB Army Watches Closely: Descending Triangle Nears Apex

CoineditionCoinedition2025/04/16 16:00
By:Maxwell Mutuma
  • SHIB forms a descending triangle, signaling a potential breakout if support holds.
  • Volume surge and RSI rebound suggest fading bearish pressure and rising accumulation.
  • Key resistance between $0.00001250–$0.00001300 could define SHIB’s short-term trend.

Shiba Inu (SHIB) faces a critical phase on its weekly chart, forming a descending triangle pattern indicative of a potential breakout. 

According to crypto analyst SHIB KNIGHT, SHIB’s price pattern is tightening within a descending triangle, often seen before a sharp move. This setup, combined with stabilizing market indicators, suggests a possible rally provided Bitcoin maintains its strength and doesn’t disrupt broader sentiment.

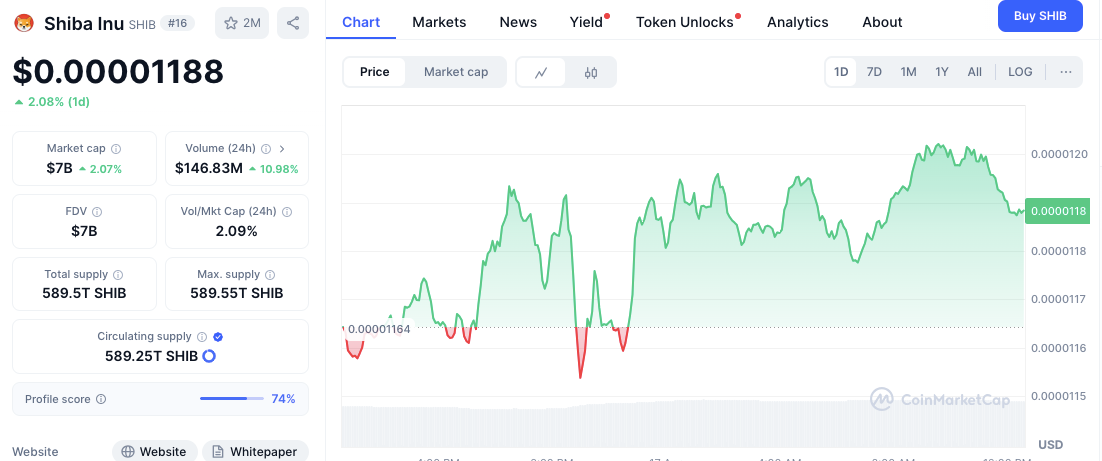
Over recent weeks, SHIB has traded in a narrowing range, forming lower highs while consistently bouncing from horizontal support near $0.00001167. This recurring price behavior highlights growing pressure at the base, hinting at a breakout. Currently priced at $0.00001188 , SHIB has posted a modest 1.82% gain in the last 24 hours, despite recording a 1.18% drop over the past week.

$SHIB pattern is squeezing and it is getting ready for a break out at weekly chart.

I expect a rise from here if Bitcoin doesn't spoil it. pic.twitter.com/bqR5Pw9BQL

— $SHIB KNIGHT (@army_shiba) April 16, 2025

What are SHIB’s Key Support and Resistance Levels?

Support near $0.00001166 has proven resilient, holding through multiple tests. Minor support also sits around $0.00001170, forming a short-term base. Immediate resistance lies between $0.00001195 and $0.00001200, a zone where prior advances halted.

Related: Shiba Inu Burn Rate Surges Over 1,500%, Yet Price Fails to Respond

Beyond this, a crucial resistance range between $0.00001250 and $0.00001300 could determine SHIB’s near-term trend. A confirmed breakout above the triangle’s descending trendline could send the token toward this zone quickly. However, a failure to hold the current support may drag the price down to the psychological $0.00001000 level.

SHIB Army Watches Closely: Descending Triangle Nears Apex image 0 SHIB Army Watches Closely: Descending Triangle Nears Apex image 1 Source: CoinMarketCap

Trading volume increased to $146.78 million over the past day, signaling renewed interest after a decline during consolidation. Rising volume accompanying price pattern completion often precedes a significant price move.

Technical Indicators Hint at Reversal

SHIB Army Watches Closely: Descending Triangle Nears Apex image 2 SHIB Army Watches Closely: Descending Triangle Nears Apex image 3 
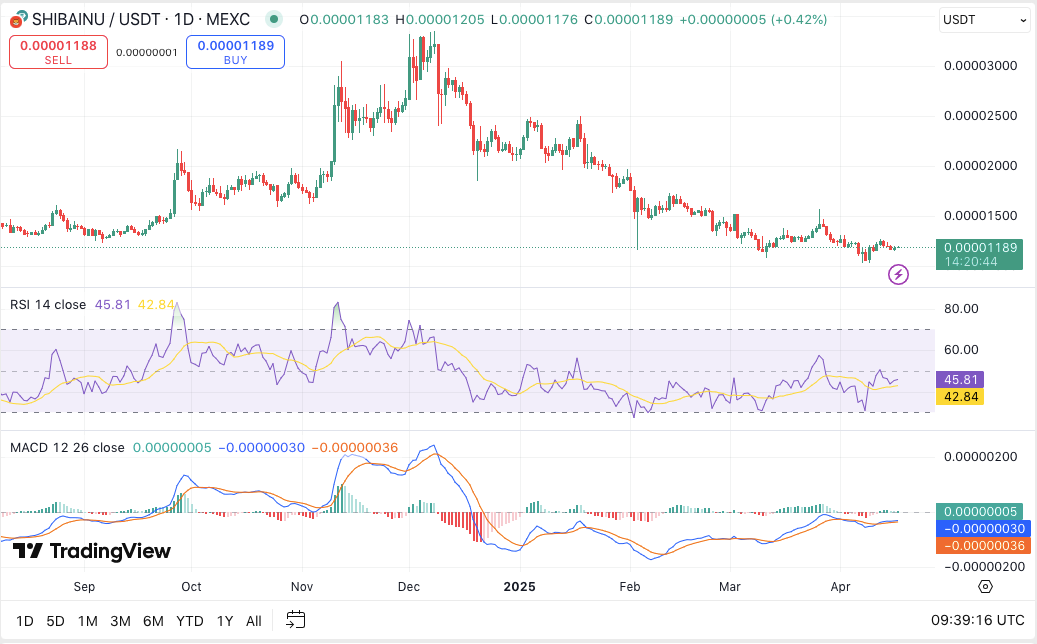
SHIB/USD daily price chart, Source: TradingView

Technical indicators offer tentative bullish signs. SHIB’s RSI now sits around 45.81, moving upward from oversold levels. This gradual shift suggests that bearish momentum is fading. While not yet in clearly bullish territory, it hints at a possible accumulation phase. A continued rise in RSI above 50 could confirm the start of a stronger uptrend.

Related: Can Shiba Inu Repeat History? SHIB Tests Support That Triggered Past Rallies

Moreover, the MACD shows early signs of a bullish crossover , with the MACD line slightly edging above the signal line. Though still weak, this crossover adds weight to the breakout theory. Significantly, both lines remain close to zero, signaling a market poised for movement in either direction.

Disclaimer: The information presented in this article is for informational and educational purposes only. The article does not constitute financial advice or advice of any kind. Coin Edition is not responsible for any losses incurred as a result of the utilization of content, products, or services mentioned. Readers are advised to exercise caution before taking any action related to the company.

0

Disclaimer: The content of this article solely reflects the author's opinion and does not represent the platform in any capacity. This article is not intended to serve as a reference for making investment decisions.

PoolX: Earn new token airdrops
Lock your assets and earn 10%+ APR
Lock now!

You may also like

New spot margin trading pair — HOLO/USDT!

Bitget Announcement2025/09/12 07:46

FUN drops by 32.34% within 24 hours as it faces a steep short-term downturn

- FUN plunged 32.34% in 24 hours to $0.008938, marking a 541.8% monthly loss amid prolonged bearish trends. - Technical breakdowns, elevated selling pressure, and forced liquidations highlight deteriorating market sentiment and risk-off behavior. - Analysts identify key support below $0.0080 as critical, with bearish momentum confirmed by RSI (<30) and MACD indicators. - A trend-following backtest strategy proposes short positions based on technical signals to capitalize on extended downward trajectories.

Bitget-RWA2025/09/12 06:14
FUN drops by 32.34% within 24 hours as it faces a steep short-term downturn

OPEN has dropped by 189.51% within 24 hours during a significant market pullback

- OPEN's price plummeted 189.51% in 24 hours to $0.8907, marking its largest intraday decline in history. - The token fell 3793.63% over 7 days, matching identical monthly and yearly declines, signaling severe bearish momentum. - Technical analysts cite broken support levels and lack of bullish catalysts as key drivers of the sustained sell-off. - Absence of stabilizing volume or reversal patterns leaves the market vulnerable to further downward pressure.

Bitget-RWA2025/09/12 06:14
OPEN has dropped by 189.51% within 24 hours during a significant market pullback

New spot margin trading pair — LINEA/USDT!

Bitget Announcement2025/09/11 10:04