Bitget App
Trade smarter
Buy cryptoMarketsTradeFuturesEarnWeb3SquareMore
Trade
Spot
Buy and sell crypto with ease
Margin
Amplify your capital and maximize fund efficiency
Onchain
Going Onchain, without going Onchain!
Convert & block trade
Convert crypto with one click and zero fees
Explore
Launchhub
Gain the edge early and start winning
Copy
Copy elite trader with one click
Bots
Simple, fast, and reliable AI trading bot
Trade
USDT-M Futures
Futures settled in USDT
USDC-M Futures
Futures settled in USDC
Coin-M Futures
Futures settled in cryptocurrencies
Explore
Futures guide
A beginner-to-advanced journey in futures trading
Futures promotions
Generous rewards await
Overview
A variety of products to grow your assets
Simple Earn
Deposit and withdraw anytime to earn flexible returns with zero risk
On-chain Earn
Earn profits daily without risking principal
Structured Earn
Robust financial innovation to navigate market swings
VIP and Wealth Management
Premium services for smart wealth management
Loans
Flexible borrowing with high fund security
Stellar (XLM) To Make Rebound? Key Harmonic Pattern Signaling an Upside Move

Stellar (XLM) To Make Rebound? Key Harmonic Pattern Signaling an Upside Move

CoinsProbeCoinsProbe2025/04/22 07:12
By:Nilesh Hembade

Date: Mon, April 21, 2025 | 06:58 AM GMT

In the cryptocurrency market over the last week, major altcoins are showing signs of a rebound after enduring a sharp correction since the start of this year. In this relief rally, Stellar (XLM) is coming back onto the green track with noticeable weekly gains.

But there’s a shift in momentum brewing as a classic harmonic pattern now hints that this rebound could rise even further.

Stellar (XLM) To Make Rebound? Key Harmonic Pattern Signaling an Upside Move image 0 
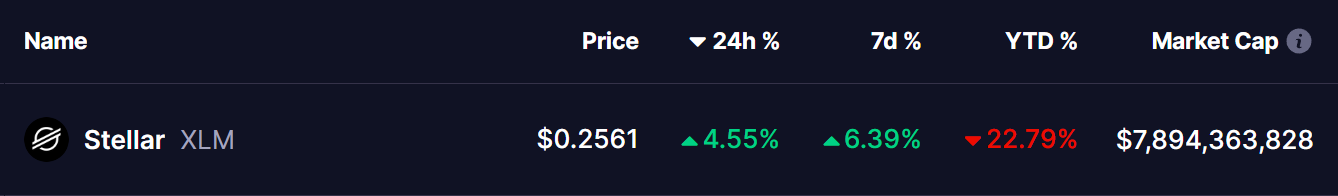
Source: Coinmarketcap

Harmonic Pattern Signals More Upside Move

The daily chart for XLM reveals the formation of a Bearish Gartley Pattern, but as of now, there’s still plenty of upside room left as the token approaches point D to complete the structure.

XLM’s sharp decline began around March 2, after it failed to hold above the $0.3754 resistance level (marked as point X). Since then, the token lost nearly 47% of its value, eventually bottoming out near $0.20 on April 7 (point C).

Stellar (XLM) To Make Rebound? Key Harmonic Pattern Signaling an Upside Move image 1 
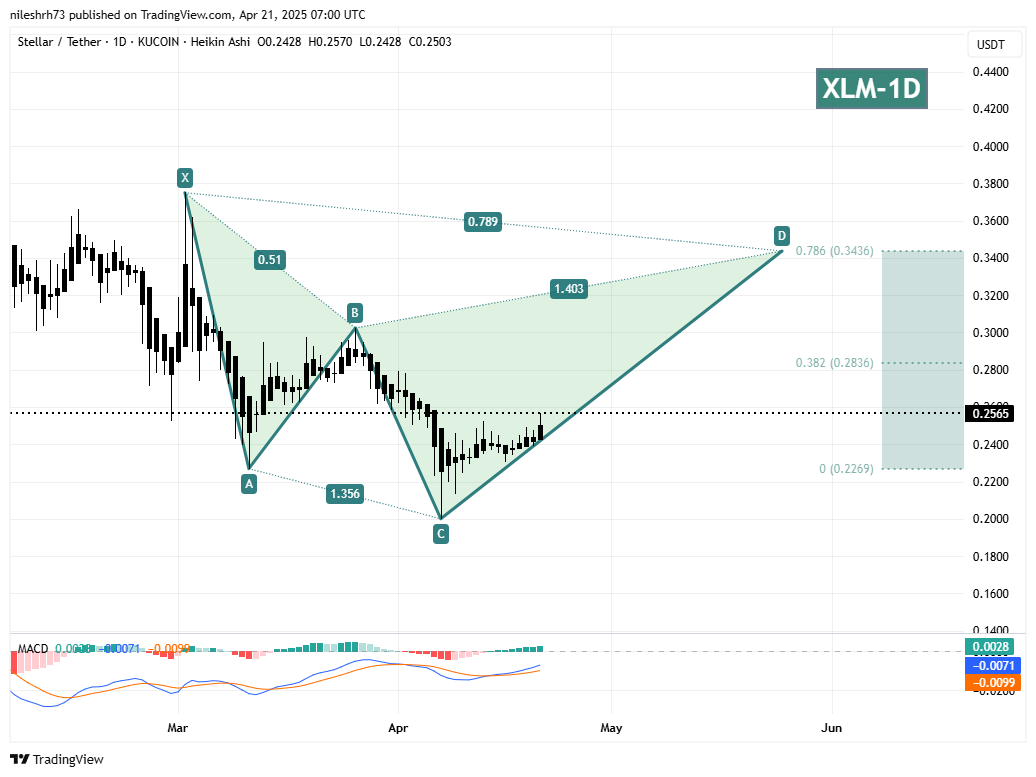
Stellar (XLM) Daily Chart/Coinsprobe (Source: Tradingview)

However, since hitting that low, XLM has shifted gears. The recent price action suggests it is now completing the CD leg of the pattern — potentially setting the stage for a continuation of this rebound.

Looking at the current setup:

  • XLM is trading near $0.2502, steadily climbing.
  • MACD is printing early bullish momentum, with a bullish crossover happening below the zero line — a classic sign of trend reversal brewing.
  • The pattern’s target — point D — sits around $0.3436, aligned with the 78.6% Fibonacci retracement of the X-A leg.

If the pattern fully plays out, XLM could gain around 34% from the current levels.

What’s Ahead?

However, caution is still advised: typically, bearish reactions occur once harmonic patterns like the Gartley complete. As XLM approaches point D, profit-taking and volatility could spike, meaning a strong reaction — either a short-term pullback or consolidation — is very possible.

For now, though, the path seems tilted upward, and XLM bulls might have a window to ride this momentum toward higher levels.

Disclaimer: This article is for informational purposes only and not financial advice. Always conduct your own research before investing in cryptocurrencies.

0

Disclaimer: The content of this article solely reflects the author's opinion and does not represent the platform in any capacity. This article is not intended to serve as a reference for making investment decisions.

PoolX: Earn new token airdrops
Lock your assets and earn 10%+ APR
Lock now!

You may also like

New spot margin trading pair — HOLO/USDT!

Bitget Announcement2025/09/12 07:46

FUN drops by 32.34% within 24 hours as it faces a steep short-term downturn

- FUN plunged 32.34% in 24 hours to $0.008938, marking a 541.8% monthly loss amid prolonged bearish trends. - Technical breakdowns, elevated selling pressure, and forced liquidations highlight deteriorating market sentiment and risk-off behavior. - Analysts identify key support below $0.0080 as critical, with bearish momentum confirmed by RSI (<30) and MACD indicators. - A trend-following backtest strategy proposes short positions based on technical signals to capitalize on extended downward trajectories.

Bitget-RWA2025/09/12 06:14
FUN drops by 32.34% within 24 hours as it faces a steep short-term downturn

OPEN has dropped by 189.51% within 24 hours during a significant market pullback

- OPEN's price plummeted 189.51% in 24 hours to $0.8907, marking its largest intraday decline in history. - The token fell 3793.63% over 7 days, matching identical monthly and yearly declines, signaling severe bearish momentum. - Technical analysts cite broken support levels and lack of bullish catalysts as key drivers of the sustained sell-off. - Absence of stabilizing volume or reversal patterns leaves the market vulnerable to further downward pressure.

Bitget-RWA2025/09/12 06:14
OPEN has dropped by 189.51% within 24 hours during a significant market pullback

New spot margin trading pair — LINEA/USDT!

Bitget Announcement2025/09/11 10:04