Bitget App
Trade smarter
Buy cryptoMarketsTradeFuturesEarnWeb3SquareMore
Trade
Spot
Buy and sell crypto with ease
Margin
Amplify your capital and maximize fund efficiency
Onchain
Going Onchain, without going Onchain!
Convert & block trade
Convert crypto with one click and zero fees
Explore
Launchhub
Gain the edge early and start winning
Copy
Copy elite trader with one click
Bots
Simple, fast, and reliable AI trading bot
Trade
USDT-M Futures
Futures settled in USDT
USDC-M Futures
Futures settled in USDC
Coin-M Futures
Futures settled in cryptocurrencies
Explore
Futures guide
A beginner-to-advanced journey in futures trading
Futures promotions
Generous rewards await
Overview
A variety of products to grow your assets
Simple Earn
Deposit and withdraw anytime to earn flexible returns with zero risk
On-chain Earn
Earn profits daily without risking principal
Structured Earn
Robust financial innovation to navigate market swings
VIP and Wealth Management
Premium services for smart wealth management
Loans
Flexible borrowing with high fund security
XRP Network Activity Spikes 67% While Price Forms Bullish Reversal Pattern

XRP Network Activity Spikes 67% While Price Forms Bullish Reversal Pattern

CoinEditionCoinEdition2025/04/21 16:00
By:Anisha Pandey

XRP has delivered a staggering 984% gain since 2020, vastly outperforming gold and USD. The XRP Network activity has surged 67.5%, with a sharp rise in active addresses recently. A bullish inverse head and shoulders pattern suggests a potential breakout to $2.70.

  • XRP has delivered a staggering 984% gain since 2020, vastly outperforming gold and USD.
  • The XRP Network activity has surged 67.5%, with a sharp rise in active addresses recently.
  • A bullish inverse head and shoulders pattern suggests a potential breakout to $2.70.

Looking beyond daily charts, XRP has stood out as a quiet yet powerful long-term performer since 2020. Data shows XRP surging 984% over that period, dramatically outpacing traditional safe havens like gold (which gained 78%) and underscoring the devaluation of the US dollar, which lost 25% of its purchasing power in the same timeframe. 

Simply put, $100,000 in 2020 buys only $75,000 worth of goods today, while that same amount invested in XRP would have grown nearly tenfold.

Related: What’s Next for XRP Price April 23? Analysis Eyes Key Support Test

This context matters as XRP’s network shows fresh life. Analyst Ali Martinez highlighted a sharp 67.5% spike in daily active XRP addresses (27k to 40k). This rise in user engagement often hints at future price action.

XRP Price Tests Key $2.09 Level

As of April 22 , XRP trades at $2.10, down 1.2% over the past 24 hours. Price action shows XRP testing the 20-day Exponential Moving Average (EMA) at $2.09, attempting to flip this level into support. 

However, with only a 4% rise in volume, the breakout lacks decisive bullish confirmation. To solidify momentum, bulls must drive volume significantly higher.

Related: Spotlight on XRP, Solana as 72 Crypto ETFs Seek SEC Approval This Year

Despite this short-term hesitation, a bullish inverse head and shoulders pattern is forming, according to Martinez . If confirmed, this classic reversal setup could push XRP to a target of $2.70 marking a nearly 29% rally from current levels.

Chart Analysis: Indicators Suggest Volatility Ahead

As per the daily chart below, the MACD (Moving Average Convergence Divergence) indicator recently saw the MACD line (blue) making a bullish crossover above the signal line, indicating potential upward momentum. 

However, the histogram remains relatively flat, hinting that the bullish momentum is still in its early phase and could reverse without volume confirmation.

XRP Network Activity Spikes 67% While Price Forms Bullish Reversal Pattern image 0 XRP Network Activity Spikes 67% While Price Forms Bullish Reversal Pattern image 1

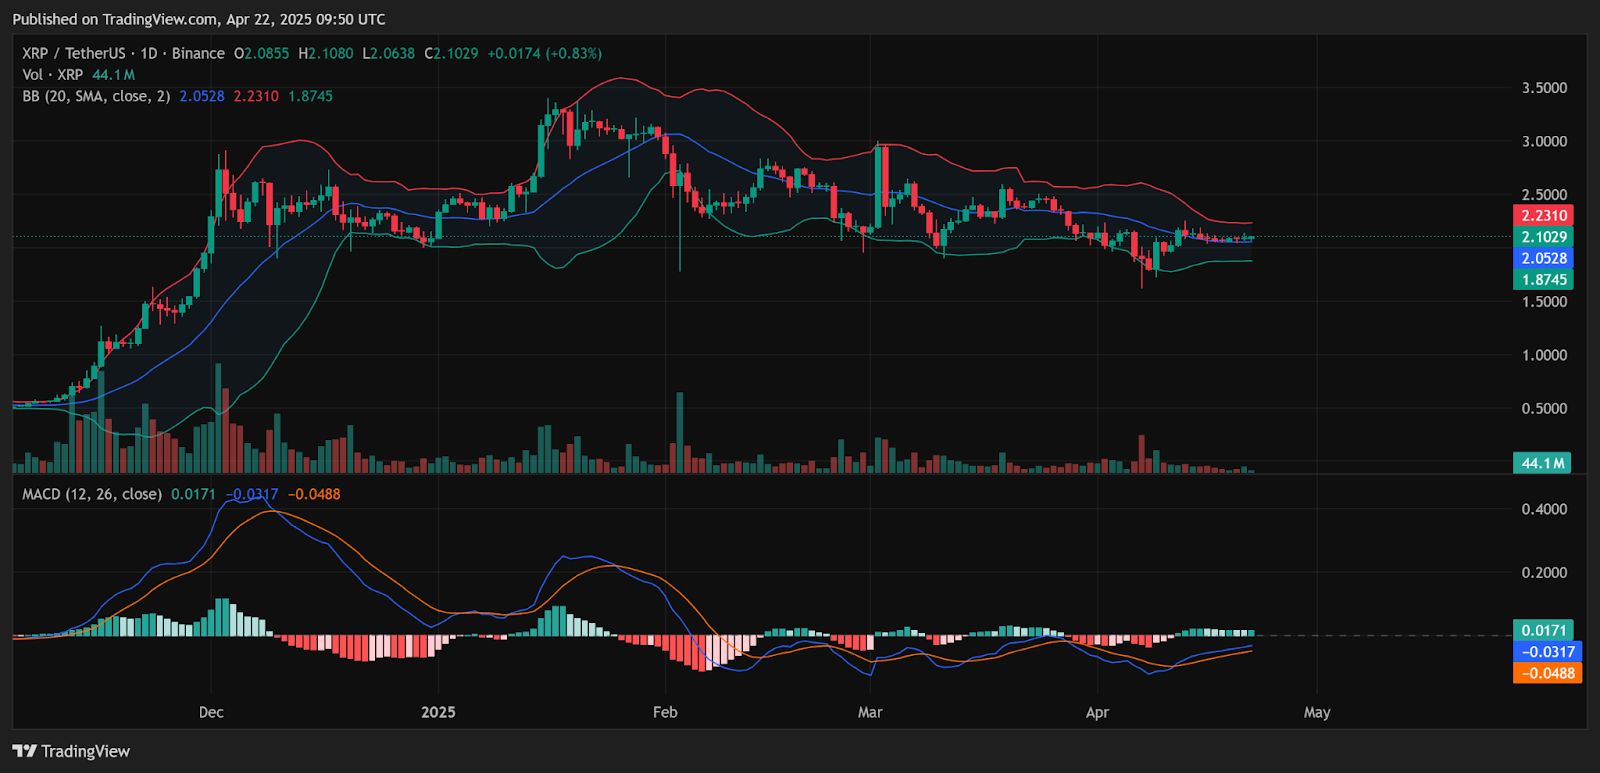
At the same time, Bollinger Bands are narrowing ($1.87-$2.23). This tightening often happens right before a spike in price volatility, meaning a bigger move could come soon. 

A daily close above the upper Bollinger Band at $2.23 would confirm bullish momentum and likely accelerate a move toward $2.70, aligning with Martinez’s projection.

On the other hand, a rejection at this range could drag XRP back to the middle Bollinger Band around $2.05 or lower, toward the support zone near $1.87, marking a 10% downside risk if buyers lose grip.

Disclaimer: The information presented in this article is for informational and educational purposes only. The article does not constitute financial advice or advice of any kind. Coin Edition is not responsible for any losses incurred as a result of the utilization of content, products, or services mentioned. Readers are advised to exercise caution before taking any action related to the company.

0

Disclaimer: The content of this article solely reflects the author's opinion and does not represent the platform in any capacity. This article is not intended to serve as a reference for making investment decisions.

PoolX: Earn new token airdrops
Lock your assets and earn 10%+ APR
Lock now!

You may also like

New spot margin trading pair — HOLO/USDT!

Bitget Announcement2025/09/12 07:46

FUN drops by 32.34% within 24 hours as it faces a steep short-term downturn

- FUN plunged 32.34% in 24 hours to $0.008938, marking a 541.8% monthly loss amid prolonged bearish trends. - Technical breakdowns, elevated selling pressure, and forced liquidations highlight deteriorating market sentiment and risk-off behavior. - Analysts identify key support below $0.0080 as critical, with bearish momentum confirmed by RSI (<30) and MACD indicators. - A trend-following backtest strategy proposes short positions based on technical signals to capitalize on extended downward trajectories.

Bitget-RWA2025/09/12 06:14
FUN drops by 32.34% within 24 hours as it faces a steep short-term downturn

OPEN has dropped by 189.51% within 24 hours during a significant market pullback

- OPEN's price plummeted 189.51% in 24 hours to $0.8907, marking its largest intraday decline in history. - The token fell 3793.63% over 7 days, matching identical monthly and yearly declines, signaling severe bearish momentum. - Technical analysts cite broken support levels and lack of bullish catalysts as key drivers of the sustained sell-off. - Absence of stabilizing volume or reversal patterns leaves the market vulnerable to further downward pressure.

Bitget-RWA2025/09/12 06:14
OPEN has dropped by 189.51% within 24 hours during a significant market pullback

New spot margin trading pair — LINEA/USDT!

Bitget Announcement2025/09/11 10:04