

Date: Tue, April 22, 2025 | 07:30 PM GMT
The cryptocurrency market has faced intense selling pressure recently, with Ethereum (ETH) posting its worst Q1 since 2018, sliding more than 45%. That bearish wave swept across the major altcoins — and the AI narrative token Ethena (ENA) wasn’t spared either.
But there’s a shift in momentum brewing. ENA has managed to stage a rebound with a noticeable 11% weekly gain, narrowing its year-to-date drop to 65%. And interestingly, a classic harmonic pattern now hints that this recovery could continue further.
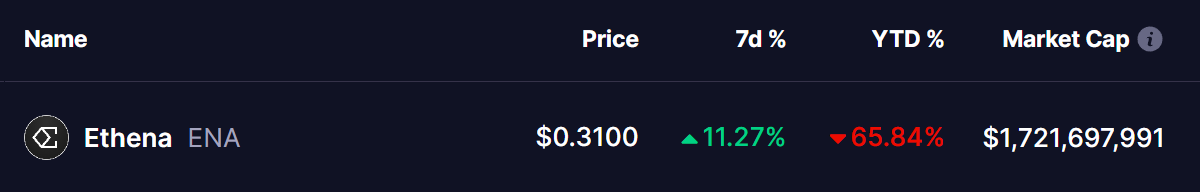 Source: Coinmarketcap
Harmonic Pattern Signals More Upside Move
On the daily timeframe, ENA is painting a very clean Bearish Gartley pattern — a structure that often signals a sharp move higher before facing key resistance.
The decline kicked off around late March after ENA struggled to hold above the $0.4434 zone (point X on the chart). From there, it tumbled nearly 42%, bottoming near $0.2535 (point A) on April 7.
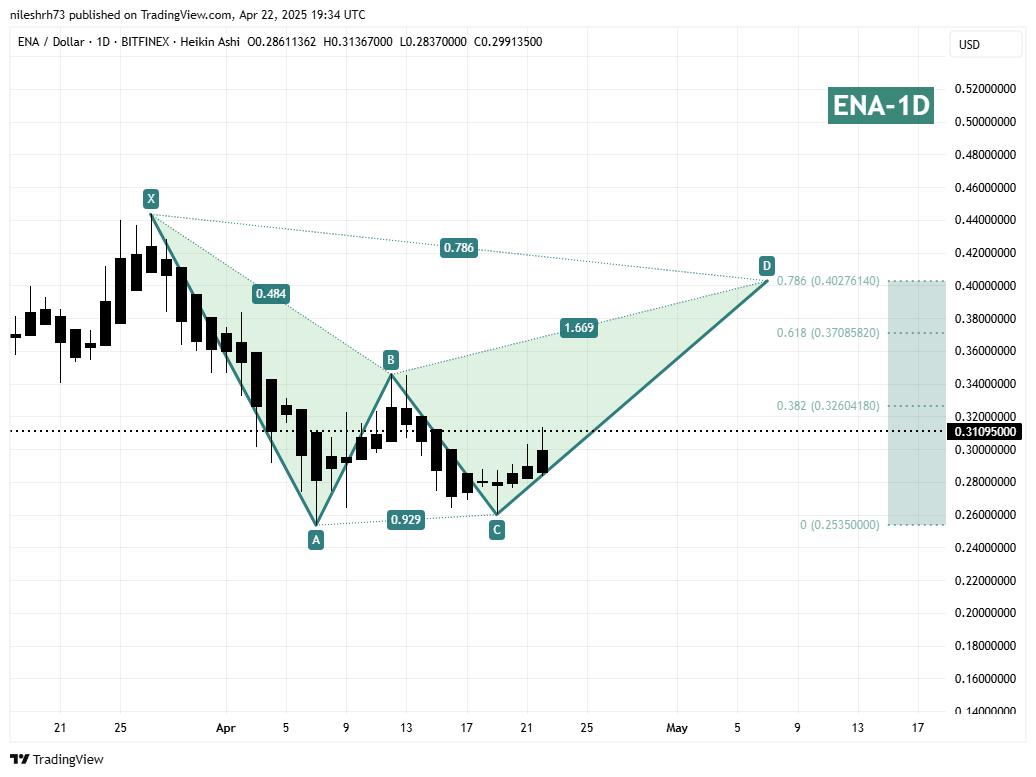 Ethena (ENA) Daily Chart/Coinsprobe (Source: Tradingview)
After this deep pullback, ENA found support and started forming its CD leg, bouncing from around $0.26 (point C). As of now, ENA is trading close to $0.31, showing steady bullish momentum inside the pattern.
According to Gartley rules:
- The B-point formed at around 48.4% retracement of XA — perfectly valid.
- The D-point is projected near $0.4027, which aligns with the 0.786 Fibonacci retracement of the original X-A move.
This suggests ENA could have another 30% upside from current levels before hitting heavy resistance.
If the Gartley plays out cleanly, traders could see price reaching that zone in the next few days.
What’s Next for ENA?
Once ENA touches the D-point, traders should be cautious. Historically, Gartley completions are followed by either a sharp retracement or a full-blown trend reversal.
For now, the short-term bias remains bullish — but eyes will be glued to the $0.40-$0.41 zone for signs of exhaustion.
Disclaimer: This article is for informational purposes only and not financial advice. Always conduct your own research before investing in cryptocurrencies.