
Trader Who Nailed 2022 Bitcoin Bottom Says Ethereum Looks Massively Bearish, Outlines ETH’s Path to Bullish Trend

A trader and analyst who accurately predicted the Bitcoin ( BTC ) bottom in November of 2022 is warning that Ethereum ( ETH ) is looking bearish overall on the weekly chart.
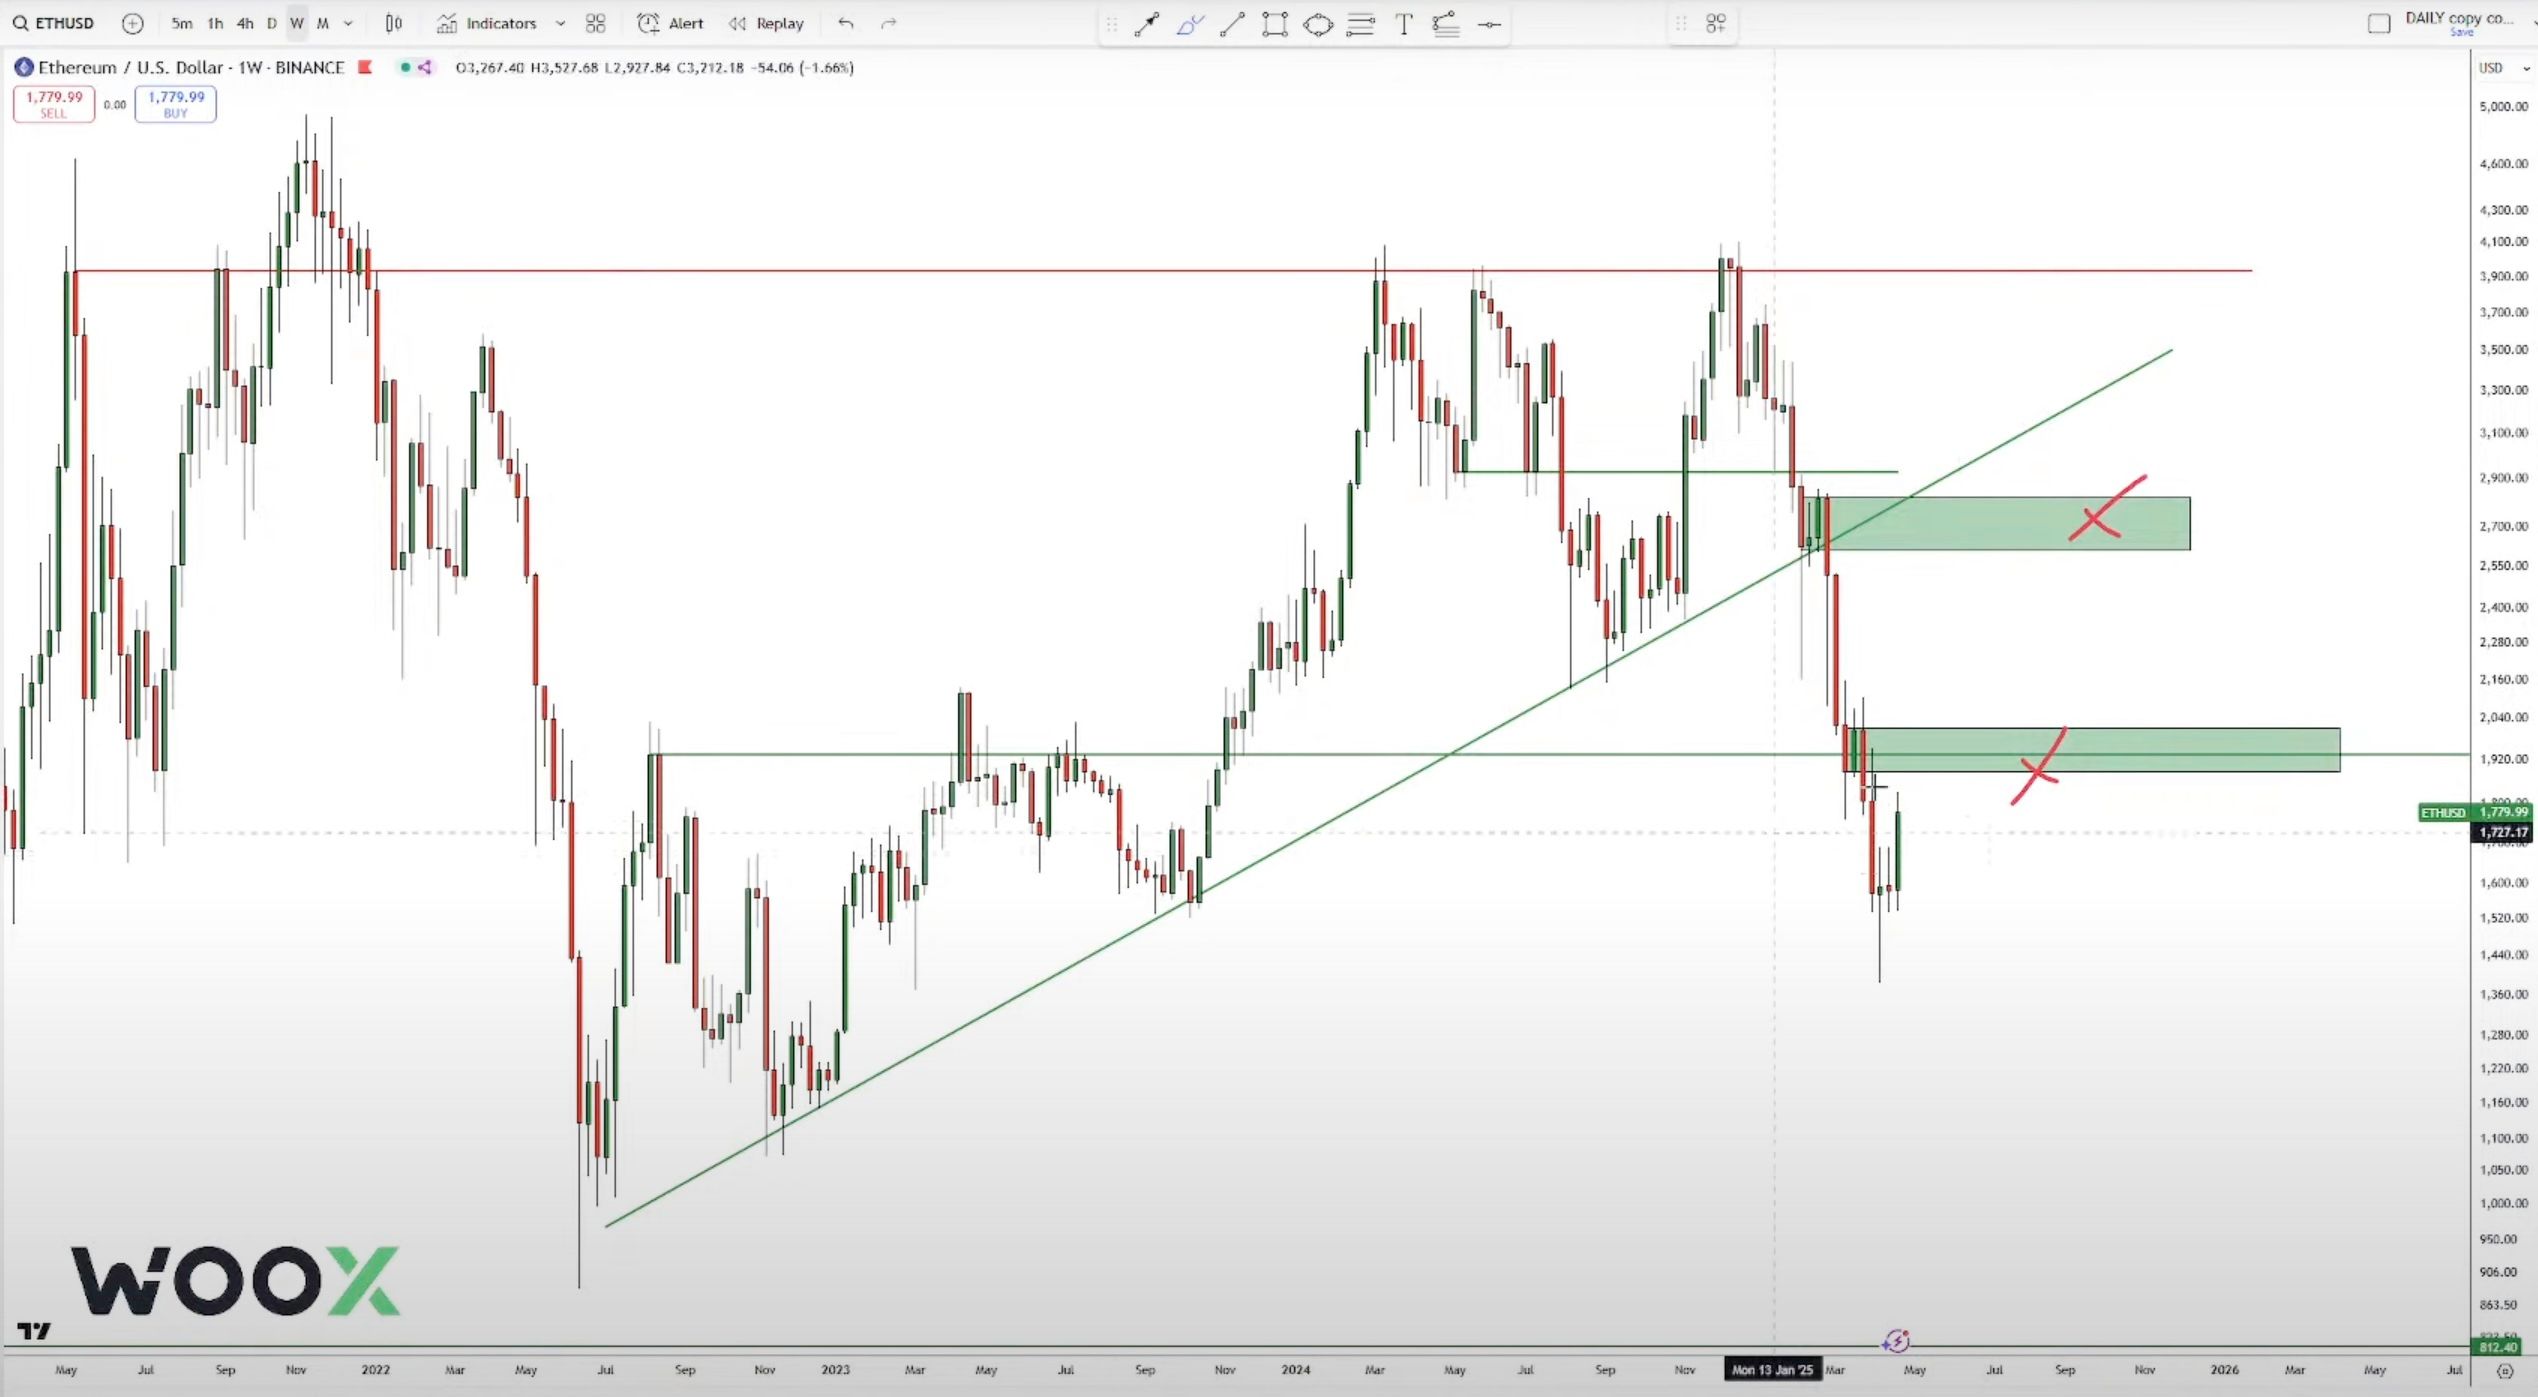
In a new video, the trader pseudonymously known as DonAlt tells the 66,200 subscribers of the TechnicalRoundup YouTube channel that ETH needs to reclaim the $2,000 level as support to start looking bullish again.
“The ETH chart, we’ve just broken down a bunch, and it needs to reclaim a little bit to look bullish. So right now, it’s still quite aggressively bearish, but we had a little bit of a good week. Reclaim $2,000 and we can start talking about major trend shift that we haven’t had in a long time.”
 Source: DonAlt/YouTube
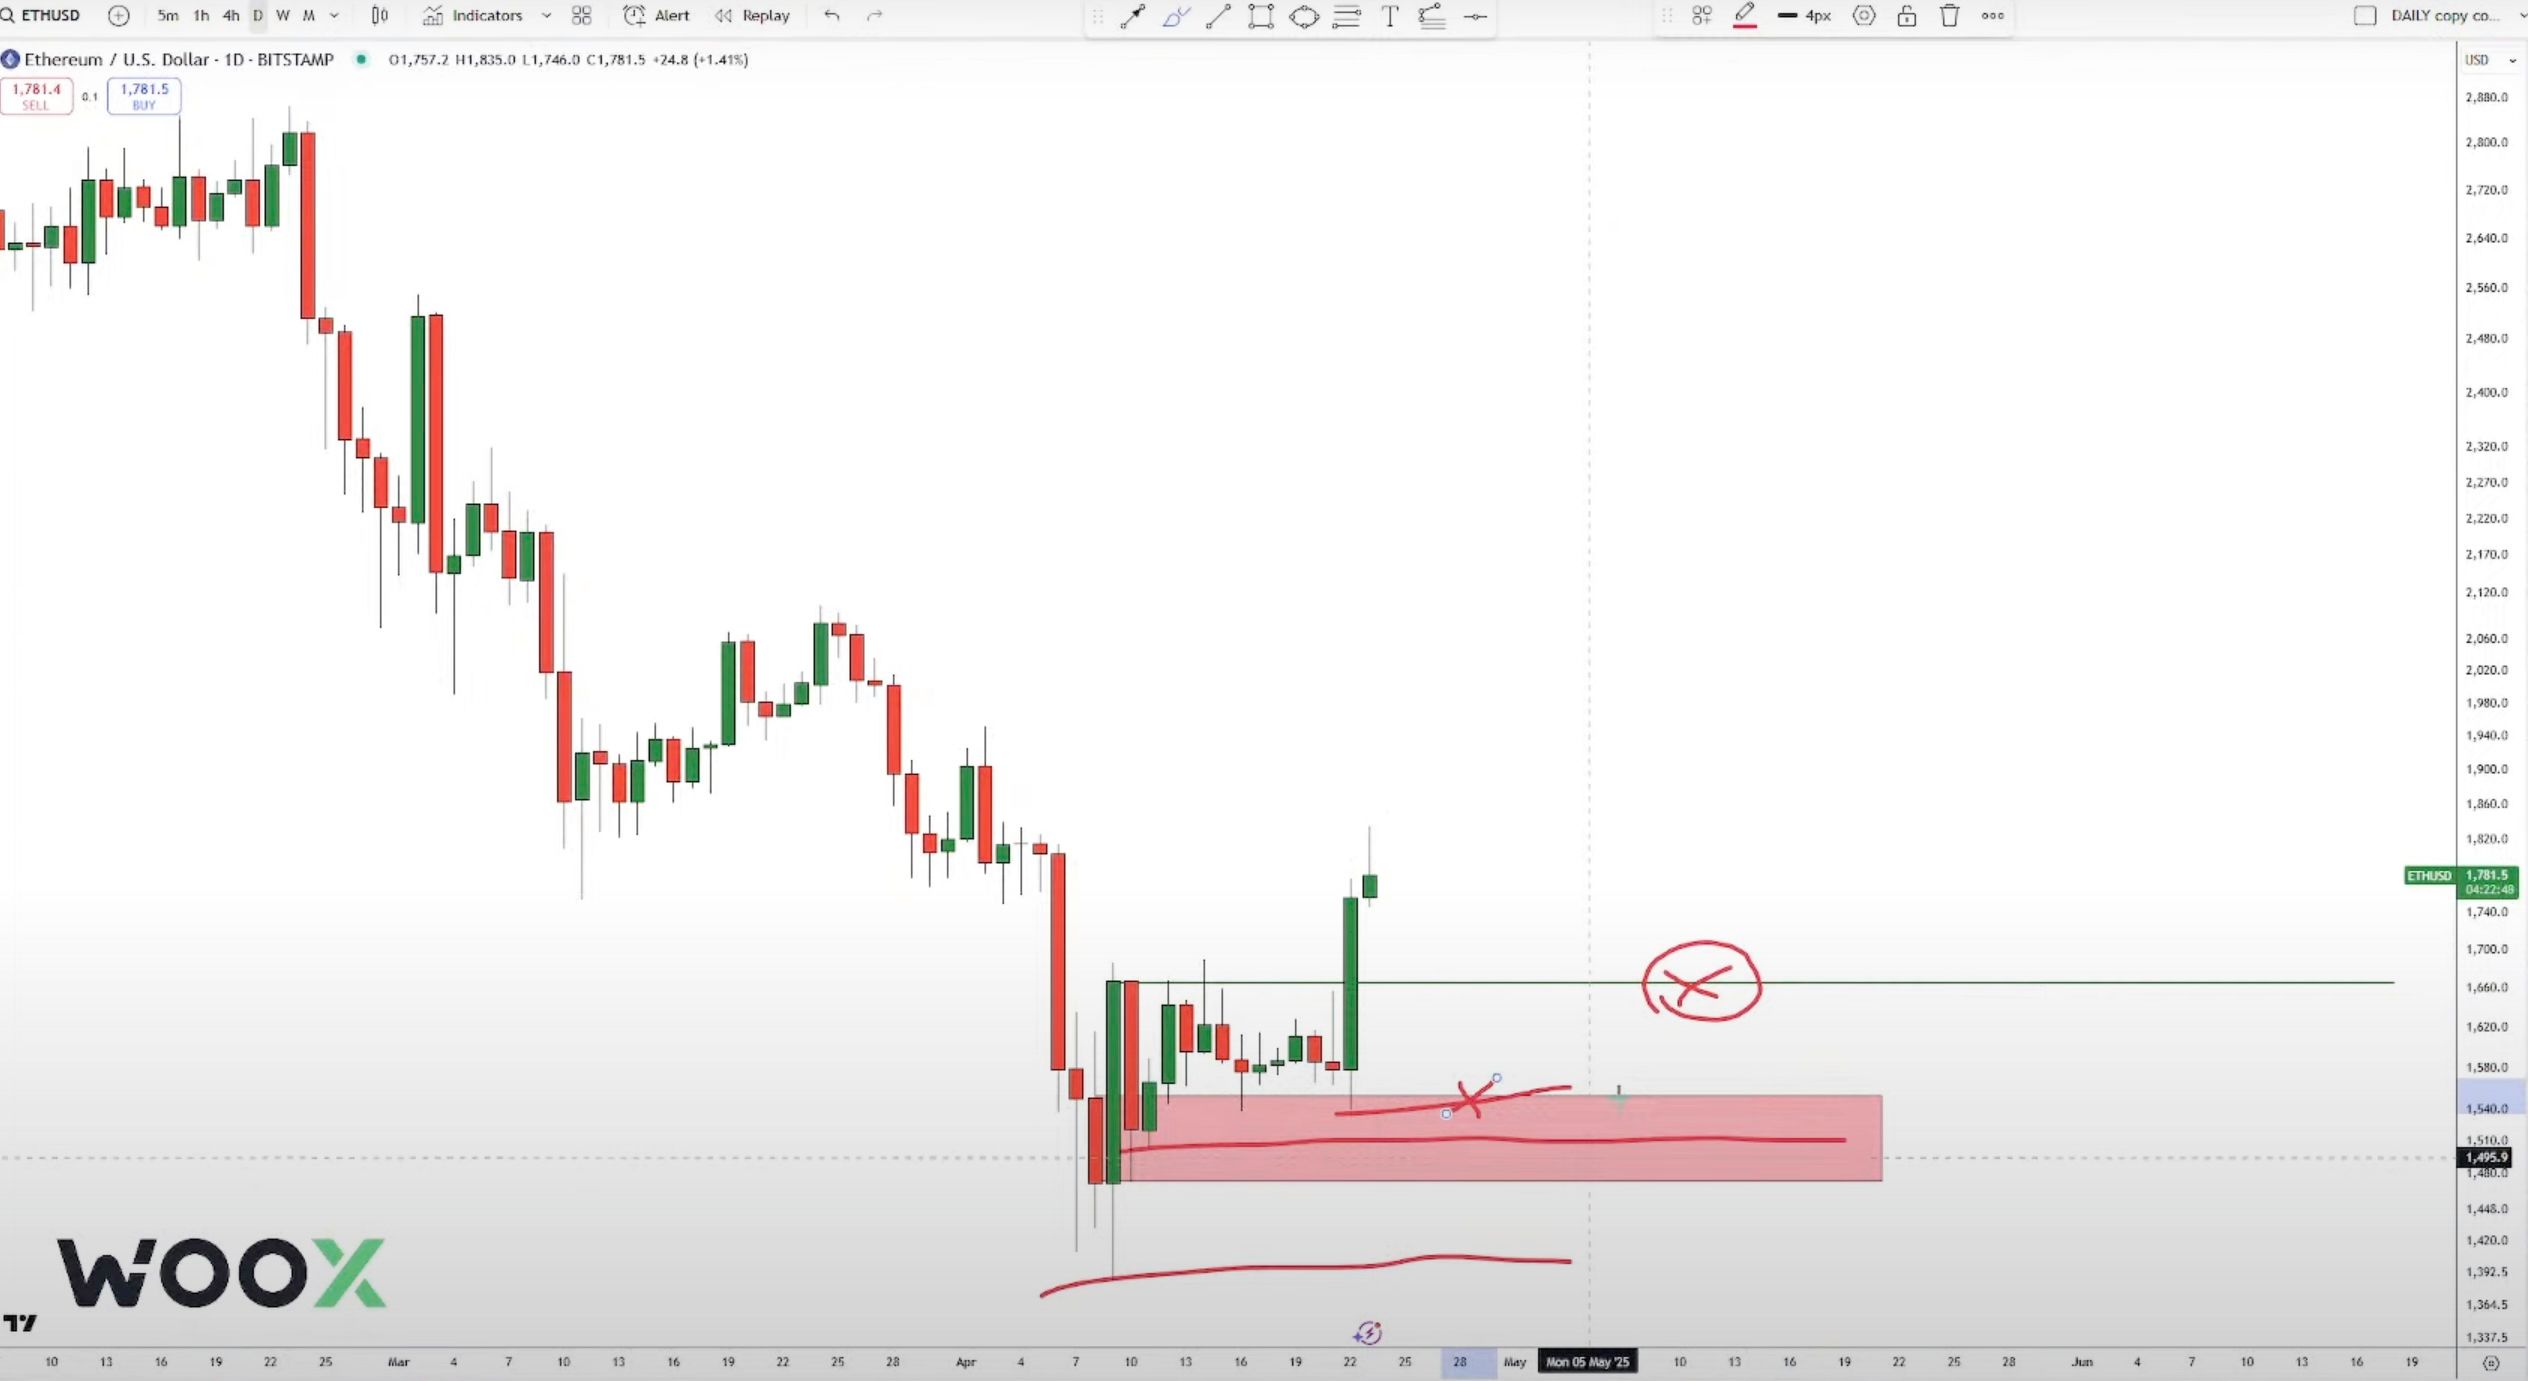
DonAlt also says that ETH needs to hold two key levels as support on the daily chart to keep alive the chance for a bullish reversal.
“What cannot be lost is basically down here [at ~$1,670]. Like you don’t want to see any close below here and you don’t want to see any move below the impulse move [at ~$1,540].”
 Source: DonAlt/YouTube
ETH is trading for $1,764 at time of writing, down 2.2% in the last 24 hours.
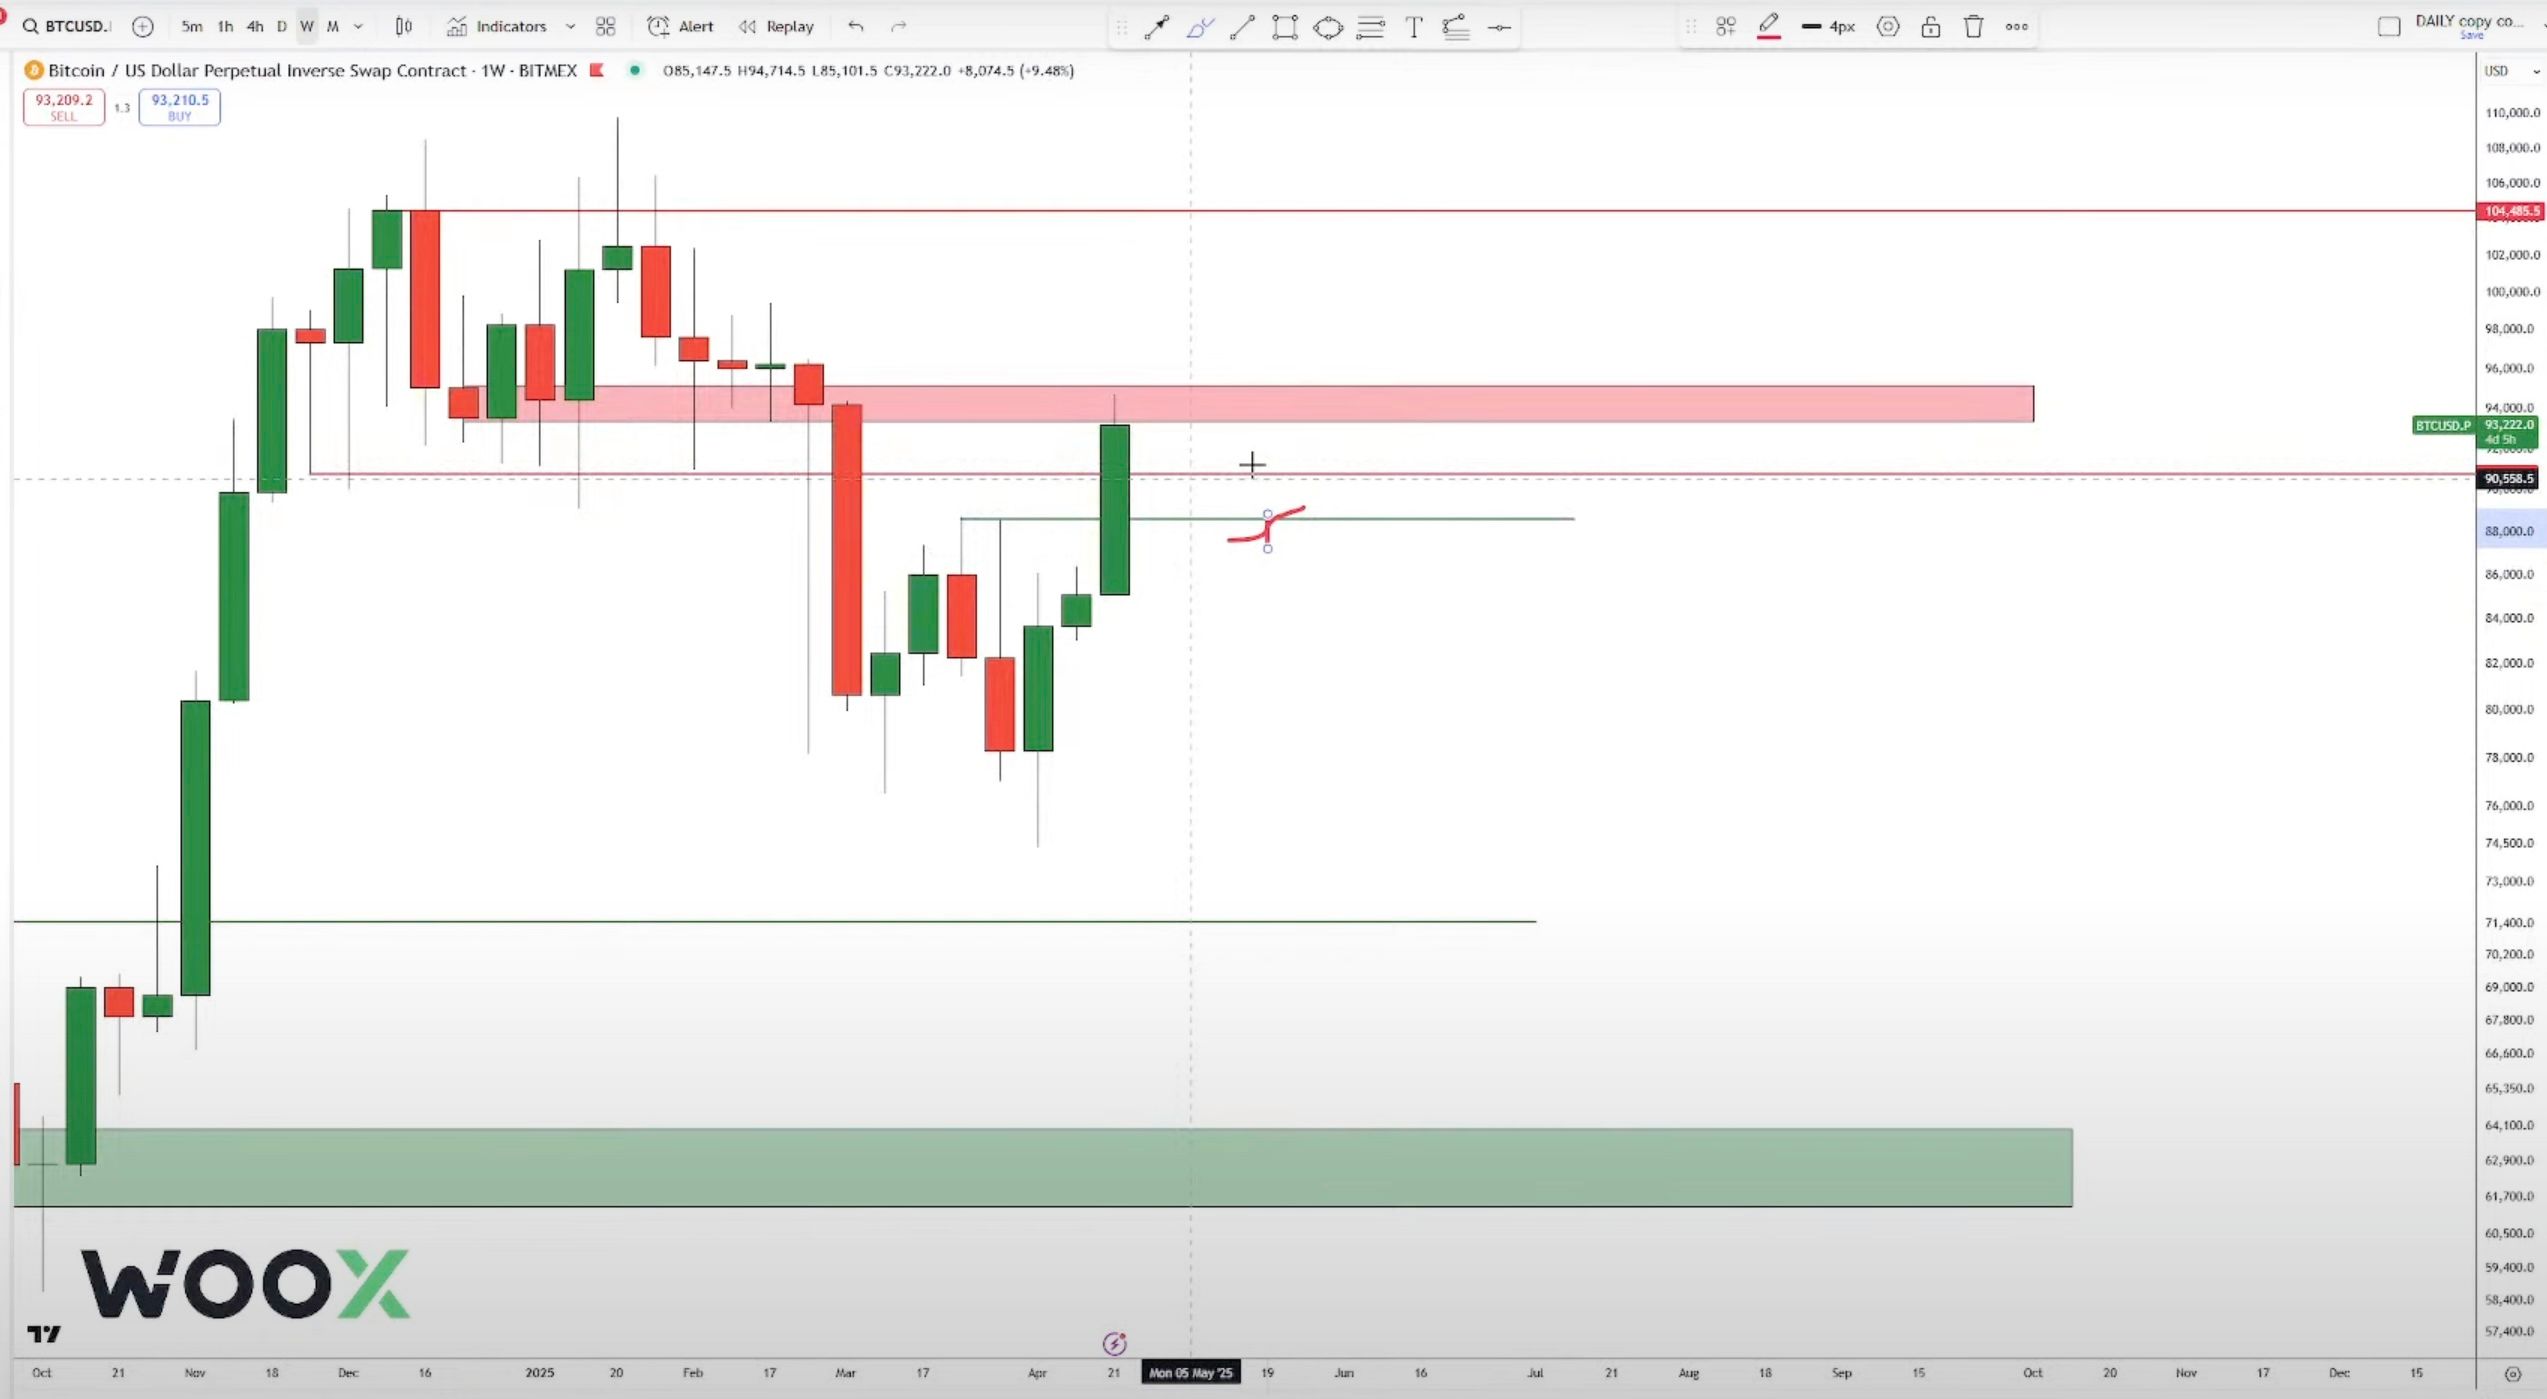
Looking at Bitcoin, the analyst says if BTC can hold $90,000 as support on the weekly chart, it would likely confirm a bullish trend.
“Below here [$89,000], very scary. Close above $90,000 [on the weekly], early signal that the trend has shifted back to bullish again.”
 Source: DonAlt/YouTube
Bitcoin is trading for $93,506 at time of writing, flat on the day.
Follow us on X , Facebook and Telegram
Don't Miss a Beat – Subscribe to get email alerts delivered directly to your inbox
Check Price Action
Surf The Daily Hodl Mix
Generated Image: Midjourney
Disclaimer: The content of this article solely reflects the author's opinion and does not represent the platform in any capacity. This article is not intended to serve as a reference for making investment decisions.
You may also like
New spot margin trading pair — HOLO/USDT!
FUN drops by 32.34% within 24 hours as it faces a steep short-term downturn
- FUN plunged 32.34% in 24 hours to $0.008938, marking a 541.8% monthly loss amid prolonged bearish trends. - Technical breakdowns, elevated selling pressure, and forced liquidations highlight deteriorating market sentiment and risk-off behavior. - Analysts identify key support below $0.0080 as critical, with bearish momentum confirmed by RSI (<30) and MACD indicators. - A trend-following backtest strategy proposes short positions based on technical signals to capitalize on extended downward trajectories.

OPEN has dropped by 189.51% within 24 hours during a significant market pullback
- OPEN's price plummeted 189.51% in 24 hours to $0.8907, marking its largest intraday decline in history. - The token fell 3793.63% over 7 days, matching identical monthly and yearly declines, signaling severe bearish momentum. - Technical analysts cite broken support levels and lack of bullish catalysts as key drivers of the sustained sell-off. - Absence of stabilizing volume or reversal patterns leaves the market vulnerable to further downward pressure.

New spot margin trading pair — LINEA/USDT!